Document 12975962
advertisement

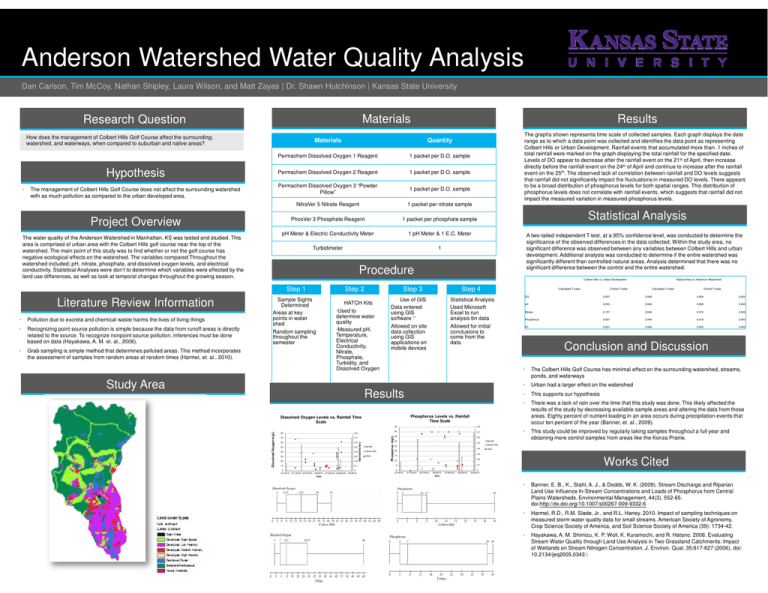
Anderson Watershed Water Quality Analysis Dan Carlson, Tim McCoy, Nathan Shipley, Laura Wilson, and Matt Zayas | Dr. Shawn Hutchinson | Kansas State University Materials Research Question How does the management of Colbert Hills Golf Course affect the surrounding; watershed, and waterways, when compared to suburban and native areas? Hypothesis The management of Colbert Hills Golf Course does not affect the surrounding watershed with as much pollution as compared to the urban developed area. Quantity Permachem Dissolved Oxygen 1 Reagent 1 packet per D.O. sample Permachem Dissolved Oxygen 2 Reagent 1 packet per D.O. sample Permachem Dissolved Oxygen 3 “Powder Pillow” 1 packet per D.O. sample NitraVer 5 Nitrate Reagent 1 packet per nitrate sample PhosVer 3 Phosphate Reagent 1 packet per phosphate sample pH Meter & Electric Conductivity Meter 1 pH Meter & 1 E.C. Meter Turbidimeter 1 Project Overview The water quality of the Anderson Watershed in Manhattan, KS was tested and studied. This area is comprised of urban area with the Colbert Hills golf course near the top of the watershed. The main point of this study was to find whether or not the golf course has negative ecological effects on the watershed. The variables compared Throughout the watershed included; pH, nitrate, phosphate, and dissolved oxygen levels, and electrical conductivity. Statistical Analyses were don’t to determine which variables were effected by the land use differences, as well as look at temporal changes throughout the growing season. Pollution due to excreta and chemical waste harms the lives of living things • Recognizing point source pollution is simple because the data from runoff areas is directly related to the source. To recognize nonpoint source pollution, inferences must be done based on data (Hayakawa, A. M. et. al., 2006). • Grab sampling is simple method that determines polluted areas. This method incorporates the assessment of samples from random areas at random times (Harmel, et. al., 2010). A two-tailed independent T-test, at a 95% confidence level, was conducted to determine the significance of the observed differences in the data collected. Within the study area, no significant difference was observed between any variables between Colbert Hills and urban development. Additional analysis was conducted to determine if the entire watershed was significantly different than controlled natural areas. Analysis determined that there was no significant difference between the control and the entire watershed. Colbert Hills vs. Urban Development Sample Sights Determined Areas at key points in water shed Random sampling throughout the semester Step 2 Step 3 HATCH Kits ·Used to determine water quality ·Measured pH, Temperature, Electrical Conductivity, Nitrate, Phosphate, Turbidity, and Dissolved Oxygen Study Area Step 4 Use of GIS Data entered using GIS software Allowed on site data collection using GIS applications on mobile devices Calcualted T-value Statistical Analysis Used Microsoft Excel to run analysis on data Allowed for initial conclusions to come from the data Results Dissolved Oxygen mg/L Dissolved Oxygen Levels vs. Rainfall Time Scale 80 0.8 70 0.7 60 0.6 50 0.5 40 0.4 30 0.3 20 0.2 10 0.1 0 0 3/7/2015 3/17/2015 3/27/2015 4/6/2015 4/16/2015 4/26/2015 5/6/2015 Date Rainfall Cobert Hills Urban 45 0.8 40 0.7 35 0.5 25 0.4 20 Critical T-value 2.048 0.004 2.042 pH 0.233 2.048 0.856 2.042 Nitrate 0.157 2.048 0.074 2.042 Phosphorus 0.057 2.048 0.018 2.042 EC 0.001 2.048 0.003 2.042 Conclusion and Discussion • The Colbert Hills Golf Course has minimal effect on the surrounding watershed, streams, ponds, and waterways • Urban had a larger effect on the watershed • This supports our hypothesis • There was a lack of rain over the time that this study was done. This likely affected the results of the study by decreasing available sample areas and altering the data from those areas. Eighty percent of nutrient loading in an area occurs during precipitation events that occur ten percent of the year (Banner, et. al., 2009). • This study could be improved by regularly taking samples throughout a full year and obtaining more control samples from areas like the Konza Prairie. Rainfall Colbert Hills Urban 0.3 15 Works Cited 0.2 10 0.1 5 0 3/7/2015 Calcualted T-value 0.007 0.6 30 Natural Area vs. Anderson Watershed Critical T-value DO Phosphorus Levels vs. Rainfall Time Scale Phosporus mg/L • Statistical Analysis Procedure Step 1 Literature Review Information The graphs shown representa time scale of collected samples. Each graph displays the date range as to which a data point was collected and identifies the data point as representing Colbert Hills or Urban Development. Rainfall events that accumulated more than .1 inches of total rainfall were marked on the graph displaying the total rainfall for the specified date. Levels of DO appear to decrease after the rainfall event on the 21st of April, then increase directly before the rainfall event on the 24th of April and continue to increase after the rainfall event on the 25th. The observed lack of correlation between rainfall and DO levels suggests that rainfall did not significantly impact the fluctuations in measured DO levels. There appears to be a broad distribution of phosphorus levels for both spatial ranges. This distribution of phosphorus levels does not correlate with rainfall events, which suggests that rainfall did not impact the measured variation in measured phosphorus levels. Materials Rainfall Inches • Results 3/17/2015 3/27/2015 4/6/2015 Date 4/16/2015 4/26/2015 0 5/6/2015 • Banner, E. B., K., Stahl, A. J., & Dodds, W. K. (2009). Stream Discharge and Riparian Land Use Influence In-Stream Concentrations and Loads of Phosphorus from Central Plains Watersheds. Environmental Management, 44(3), 552-65. doi:http://dx.doi.org/10.1007/s00267-009-9332-6 • Harmel, R.D., R.M. Slade, Jr., and R.L. Haney. 2010. Impact of sampling techniques on measured storm water quality data for small streams. American Society of Agronomy, Crop Science Society of America, and Soil Science Society of America (39): 1734-42. • Hayakawa, A. M. Shimizu, K. P. Woli, K. Kuramochi, and R. Hatano. 2006. Evaluating Stream Water Quality through Land Use Analysis in Two Grassland Catchments: Impact of Wetlands on Stream Nitrogen Concentration. J. Environ. Qual. 35:617-627 (2006), doi: 10.2134/jeq2005.0343.\


