advertisement
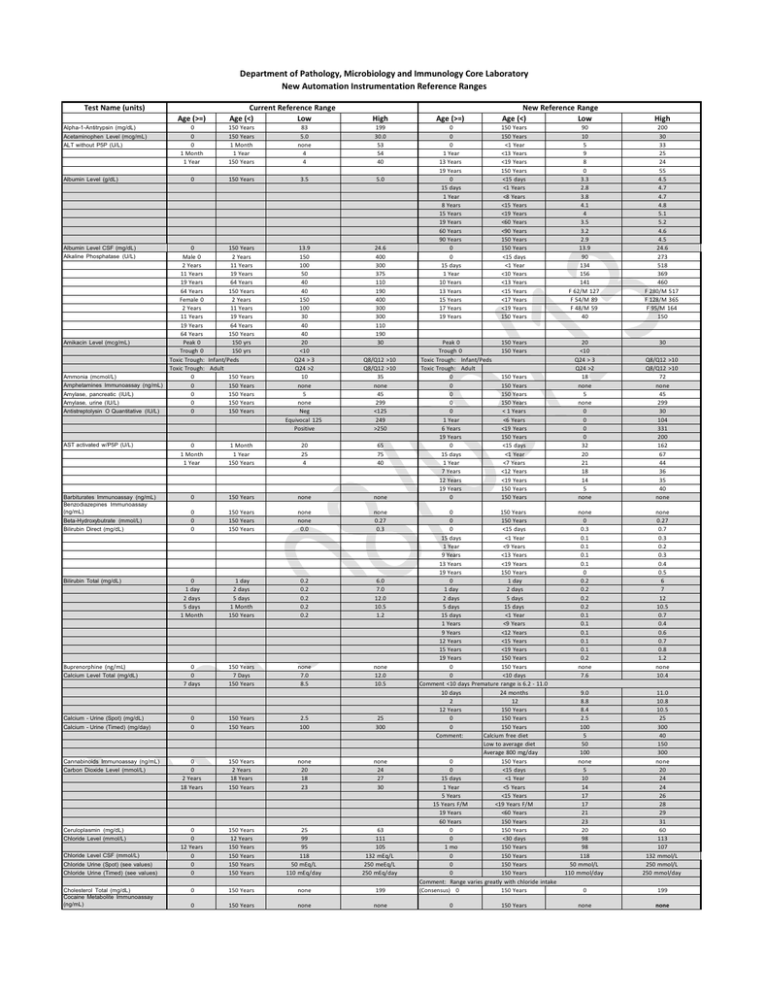
Department of Pathology, Microbiology and Immunology Core Laboratory
New Automation Instrumentation Reference Ranges Test Name (units) Current Reference Range
Age (<) Low Age (>=) Alpha-1-Antitrypsin (mg/dL)
Acetaminophen Level (mcg/mL)
ALT without P5P (U/L)
Albumin Level (g/dL)
Alkaline Phosphatase (U/L)
Amikacin Level (mcg/mL)
Ammonia (mcmol/L)
Amphetamines Immunoassay (ng/mL)
Amylase, pancreatic (IU/L)
Amylase, urine (IU/L)
Antistreptolysin O Quantitative (IU/L)
AST activated w/P5P (U/L)
83 5.0 none 4 4 199 30.0 53 54 40 0 150 Years 3.5 5.0 13.9 150 100 50 40 40 150 100 30 40 40 20 <10 Q24 > 3 Q24 >2 10 none 5 none Neg Equivocal 125 Positive 24.6 400 300 375 110 190 400 300 300 110 190 30 0 0 0 1 Year 13 Years 19 Years 0 15 days 1 Year 8 Years 15 Years 19 Years 60 Years 90 Years 0 0 15 days 1 Year 10 Years 13 Years 15 Years 17 Years 19 Years Q8/Q12 >10 Q8/Q12 >10 35 none 45 299 <125 249 >250 20 25 4 65 75 40 0 1 Month 1 Year 1 Month 1 Year 150 Years 0 Bilirubin Direct (mg/dL)
Bilirubin Total (mg/dL)
Buprenorphine (ng/mL) Calcium Level Total (mg/dL)
Calcium - Urine (Spot) (mg/dL)
Calcium - Urine (Timed) (mg/day)
Cannabinoids Immunoassay (ng/mL)
Carbon Dioxide Level (mmol/L)
Ceruloplasmin (mg/dL)
Chloride Level (mmol/L)
Chloride Level CSF (mmol/L)
Chloride Urine (Spot) (see values)
Chloride Urine (Timed) (see values)
150 Years Beta-Hydroxybutrate (mmol/L)
Cholesterol Total (mg/dL)
Cocaine Metabolite Immunoassay
(ng/mL)
Age (>=) 150 Years 150 Years 1 Month 1 Year 150 Years 0 150 Years Male 0 2 Years 2 Years 11 Years 11 Years 19 Years 19 Years 64 Years 64 Years 150 Years Female 0 2 Years 2 Years 11 Years 11 Years 19 Years 19 Years 64 Years 64 Years 150 Years Peak 0 150 yrs Trough 0 150 yrs Toxic Trough: Infant/Peds Toxic Trough: Adult 0 150 Years 0 150 Years 0 150 Years 0 150 Years 0 150 Years Albumin Level CSF (mg/dL)
Barbiturates Immunoassay (ng/mL)
Benzodiazepines Immunoassay
(ng/mL)
High 0 0 0 1 Month 1 Year none none 0 0 0 150 Years 150 Years 150 Years none none 0.0 none 0.27 0.3 0 1 day 2 days 5 days 1 Month 1 day 2 days 5 days 1 Month 150 Years 0.2 0.2 0.2 0.2 0.2 6.0 7.0 12.0 10.5 1.2 0 0 7 days 150 Years 7 Days 150 Years none 7.0 8.5 none 12.0 10.5 0 0 150 Years 150 Years 2.5 100 25 300 0 0 2 Years 18 Years 150 Years 2 Years 18 Years 150 Years none 20 18 23 none 24 27 30 0 0 12 Years 0 0 0 150 Years 12 Years 150 Years 150 Years 150 Years 150 Years 25 99 95 118 50 mEq/L 110 mEq/day 63 111 105 132 mEq/L 250 meEq/L 250 mEq/day 0 150 Years 0 none 150 Years 199 none none New Reference Range Age (<) Low 150 Years 150 Years <1 Year <13 Years <19 Years 150 Years <15 days <1 Years <8 Years <15 Years <19 Years <60 Years <90 Years 150 Years 150 Years <15 days <1 Year <10 Years <13 Years <15 Years <17 Years <19 Years 150 Years Peak 0 150 Years Trough 0 150 Years Toxic Trough: Infant/Peds Toxic Trough: Adult 0 150 Years 0 150 Years 0 150 Years 0 150 Years 0 < 1 Years 1 Year <6 Years 6 Years <19 Years 19 Years 150 Years 0 <15 days 15 days <1 Year 1 Year <7 Years 7 Years <12 Years 12 Years <19 Years 19 Years 150 Years 0 150 Years 0 150 Years 0 150 Years 0 <15 days 15 days <1 Year 1 Year <9 Years 9 Years <13 Years 13 Years <19 Years 19 Years 150 Years 0 1 day 1 day 2 days 2 days 5 days 5 days 15 days 15 days <1 Year 1 Years <9 Years 9 Years <12 Years 12 Years <15 Years 15 Years <19 Years 19 Years 150 Years 0 150 Years 0 <10 days Comment <10 days Premature range is 6.2 ‐ 11.0 10 days 24 months 2 12 12 Years 150 Years 0 150 Years 0 150 Years Comment: Calcium free diet Low to average diet Average 800 mg/day 0 150 Years 0 <15 days 15 days <1 Year 1 Year <5 Years 5 Years <15 Years 15 Years F/M <19 Years F/M 19 Years <60 Years 60 Years 150 Years 0 150 Years 0 <30 days 1 mo 150 Years 0 150 Years 0 150 Years 0 150 Years Comment: Range varies greatly with chloride intake (Consensus) 0 150 Years 0 150 Years High 90 10 5 9 8 0 3.3 2.8 3.8 4.1 4 3.5 3.2 2.9 13.9 90 134 156 141 F 62/M 127 F 54/M 89 F 48/M 59 40 200 30 33 25 24 55 4.5 4.7 4.7 4.8 5.1 5.2 4.6 4.5 24.6 273 518 369 460 F 280/M 517 F 128/M 365 F 95/M 164 150 20 <10 Q24 > 3 Q24 >2 18 none 5 none 0 0 0 0 32 20 21 18 14 5 none 30 Q8/Q12 >10 Q8/Q12 >10 72 none 45 299 30 104 331 200 162 67 44 36 35 40 none none 0 0.3 0.1 0.1 0.1 0.1 0 0.2 0.2 0.2 0.2 0.1 0.1 0.1 0.1 0.1 0.2 none 7.6 none 0.27 0.7 0.3 0.2 0.3 0.4 0.5 6 7 12 10.5 0.7 0.4 0.6 0.7 0.8 1.2 none 10.4 9.0 8.8 8.4 2.5 100 5 50 100 none 5 10 14 17 17 21 23 20 98 98 118 50 mmol/L 110 mmol/day 11.0 10.8 10.5 25 300 40 150 300 none 20 24 24 26 28 29 31 60 113 107 132 mmol/L 250 mmol/L 250 mmol/day 0 199 none none Department of Pathology, Microbiology and Immunology Core Laboratory
New Automation Instrumentation Reference Ranges Test Name Current Reference Range New Reference Range C3 Quantitative (mg/dL)
0 150 Years 88 201 C4 Quantitative (mg/dL)
0 150 Years 15 45 Creatine Kinase (U/L)
0 150 Years 30 300 0 2 Years 4 Years 8 Years 11 Years 13 Years 18 Years 0 2 Years 4 Years 8 Years 11 Years 13 Years 18 Years 0 0 2 Years 4 Years 8 Years 11 Years 13 Years 18 Years 150 Years 2 Years 4 Years 8 Years 11 Years 13 Years 18 Years 150 Years 150 Years 150 Years none none none none none none 0.70 none none none none none none 0.70 40 1 Creatinine Level (mg/dL)
Creatinine Urine (Spot) (mg/dL)
Creatinine Urine (Timed) (g/day)
C-Reactive Protein HS - Cardiac
(mg/L)
C-Reactive Protein - Inflammatory
(mg/L)
Fructosamine (micromol/L)
GGT (U/L)
Glucose Level (mg/dL)
Glucose Tol Test 50G (mg/dL) .100 g Glucose 1 Hour (mg/dL)
.Glucose 2 Hour (mg/dL)
.Glucose 3 Hour (mg/dL)
Glucose Baseline (mg/dL)
Glucose CSF (mg/dL)
Glucose Urine (Spot) (mg/dL)
Glucose Urine (Timed) (mg/day)
Haptoglobin (mg/dL)
Cholesterol Level HDL (mg/dL)
Homocysteine (micromol/L) IgA Quantitative (mg/dL)
IgG Quantitative (mg/dL)
IgG Quantitative CSF (mg/dL)
0 15 days 1 Year 19 Years 0 1 Year 19 Years 0 14 days <1 Year <19 Years 150 Years <1 Year <19 Years 150 Years 150 Years 0.60 0.70 0.80 0.90 1.00 1.20 1.50 0.50 0.60 0.70 0.80 0.90 1.10 1.50 200 1.6 0 15 days 1 Year 4 Years 7 Years 12 Years 15 Years 17 Years 19 Years 0 150 years 0 <3.0 0 150 Years none 2.9 0 0 150 Years 150 Years 205 5 285 40 0 7 days 1 Month 1 Year 7 days 30 days 1 Year 150 Years 45 70 70 70 120 110 110 110 0 0 0 0 0 0 0 0 0 150 Years 150 Years 150 Years 150 Years 150 Years 150 Years 150 Years 150 Years 150 Years none none none none none 45 1 50 16 139 180 155 140 95 75 14.9 300 200 0 0 0 0 1 Month 2 Months 3 Months 5 Months 7 Months 10 Months 1 Year 2 Years 4 Years 6 Years 9 Years 0 1 Month 2 Months 3 Months 5 Months 7 Months 10 Months 1 Year 2 Years 4 Years 6 Years 9 Years 0 150 Years 150 Years 150 Years 1 Month 2 Months 3 Month 5 Months 7 Months 10 Months 1 Year 2 Years 4 Years 6 Years 9 Years 150 Years 1 Month 2 Months 3 Months 5 Months 7 Months 10 Months 1 Year 2 Years 4 Years 6 Years 9 Years 150 Years 150 Years 41 51 5.0 1 3 4 8 11 16 14 14 25 33 45 68 251 206 176 172 217 294 345 424 463 633 608 694 0.5 none none 15.0 53 47 73 84 90 84 106 159 154 202 236 378 906 601 581 814 904 1069 1213 1135 1236 1280 1572 1618 5.9 <15 days <1 Year <4 Years <7 Years <12 Years <15 Years <17 Years <19 Years 150 Years 50 51 83 82 7 13 15 Female 29 Male 30 0.42 0.32 0.38 0.44 0.52 0.57 F 0.59/M 0.66 F 0.60/M 0.69 F 0.57/M 0.72 121 160 152 193 30 37 53 168 200 1.05 0.53 0.54 0.64 0.69 0.8 F 0.86/M 1.04 F 0.88/M 1.10 F 1.11/M 1.25 0 0 150 Years 150 Years 40 0.7 200 2.5 18 Years 150 Years 0 2.9 0 14 days 0.3 15 days <15 Years 0.1 15 Years <19 Years 0.1 19 Years 150 Years 0 0 150 yrs 205 0 14 days 23 15 days <1 Year 8 1 Years < 11 Years 6 11 Years <19 Years 7 18 Years 150 Years F 9 /M 12 Newborn, 0 <2 day 40 Comment <2 days: Premature range is 20 ‐ 60 mg/dL Newborn, 2 day <1 month 50 Child 1 month <18 years 60 Adult 18 years 150 Years 70 0 150 Years none (CONSENSUS ADA) 0
150 Years none 0 150 Years none 0 150 Years none 0 150 Years none 0 150 Years 45 0 150 Years 1 0 150 Years 0 0 <15 days 0 15 days <1 Year 7 1 Year <12 Years 7 12 Years <19 Years 7 19 Years <60 Years 14 60 Years 150 Years 40 (Consensus NCEP) 0 150 Years F < 50 / M < 40 0 0 3 mos 1 Year 3 Years 6 Years 14 Years 19 Years 60 Years 150 Years <3mos 1 Year <3 Years <6 Years <14 Years <19 Years <60 Years 150 Years 0 <15 days 15 days <1 Year 1 Years <4 Years 4 Years <10 Years 10 Years <19 Years 19 Years <80 Years 80 Years 150 Years No reference range established for > 80 years of age 0 150 Years 6.1 1 1.7 5 285 219 127 16 21 F 36/M 64 60 80 99 99 139 180 155 140 95 75 14.9 499 10 221 163 179 258 273 60 5.0 1 8 0 30 50 50 F 65/M 63 F 69/M 101 15.0 34 91 90 150 220 290 F 421/M 484 F 517/M 645 320 110 320 540 660 F 552/M 540 1400 700 1150 1360 1530 F 1631/M 1822 0.5 5.9 Department of Pathology, Microbiology and Immunology Core Laboratory
New Automation Instrumentation Reference Ranges Test Name Current Reference Range 0 1 1 Month 2 Months 3 Months 5 Months 7 Months 10 Months 1 Year 2 Years 4 Years 7 Years 9 Years 0 1 Month 1 Year 12 Years 0 IgM Quantitative (mg/dL)
Iron Level (mcg/dL)
Lactate Dehydrogenase (IU/L)
1 1 Month 2 Months 3 Months 5 Months 7 Months 10 Months 1 Year 2 Years 4 Years 7 Years 9 Years 150 Years 1 Month 1 Year 12 Years 150 Years 150 Years 0 150 Years 0 150 Years 0 150 Years 0 ‐ 150 yrs Optimal Near to Above Optimal Borderline High High
Very High 0 150 Years Lactate Dehydrogenase CSF (IU/L)
Lactic Acid (mmol/L)
Lactic Acid CSF (mmol/L)
LDL Direct (Chemistry) (mg/dL)
Lipase Level (U/L)
Lithium Level (mmol/L)
Magnesium Level (mg/dL)
Magnesium Urine (Spot) (mg/dL)
Magnesium Urine (Timed) (mg/day)
Methadone Immunoassay (ng/mL)
Microalbumin Urine (Spot) (mcg/mL)
New Reference Range 0 20 17 24 33 34 41 43 47 43 48 52 60 100 40 50 50 none 19 87 105 101 108 126 149 173 200 196 207 242 263 250 100 120 150 225 0 0.5 0.0 <100 100 130 160 >= 190 10 225 2.2 2.8 Oxycodone Immunoassay Urine (ng/mL) 60 150 Years 150 Years 0.6 1.8 1.2 2.4 0 0 0 0 150 Years 150 Years 150 Years 150 Years 2 70 none 0 20 120 none 14.9 mcg/mL 0 Phosphorus Level (mg/dL)
Phosphorus Urine (Spot) (mg/dL)
Phosphorus Urine (Timed) (mg/day)
Potassium Level (mmol/L)
plasma range
150 Years none 150 Years 10 2 Years 150 Years none 4.5 4.5 2.5 none 9.0 6.7 4.5 0 0 0 10 150 Years 150 Years 10 150 Years 20 400 4.0 3.3 150 mg/dL 1300 mg/day 6.0 4.8 3.5 5.1 0 0 0 150 Years 150 Years 150 Years 25 25 18 125 mEq/L 125 mEq/day 45 0 1 Month 3 Months 6 Months 18 Years 40 Years 50 Years 60 Years 0 0 0 0 0 1 Month 3 Months 6 Months 18 Years 40 Years 50 Years 60 Years 150 Years 150 Years 150 Years 150 Years 150 Years 150 Years 20 20 15 5 15 20 25 30 none 0 50 2.00 0 170 100 50 40 45 50 55 60 none <15 100 5.00 15 Salicylate Level (mg/dL)
0 2.0 Sodium Level (mmol/L)
0 1 Month 150 Years Toxic 1 Month 150 Years 30.0 >50 145 145 Potassium Urine (Spot) (mmol/L)
Potassium Urine (Timed) (mmol/day)
Prealbumin (mg/dL)
Protein CSF (mg/dL)
Protein Level Body Fluid
Protein Urine (Spot) (mg/dL)
Protein Urine (Timed) (mg/day)
Quinidine Level (mcg/ml)
Rheumatoid Factor Quantitative (IU/ml)
Sodium Urine (Spot) (see values)
Sodium Urine (Timed) (see values)
0 0 150 Years 150 Years 135 135 40 mEq/L 100 mEq/day 40 70 90 F 190/M 150 F 293/M 240 0 14 Years 19 Years <14 Years <19 Years 150 Years 16 20 50 128 168 175 <15 days <1 Year <10 Years <15 Years M/F <19 Years 150 Years 150 Years 150 Years 150 Years Optimal Near to Above Optimal Borderline High High Very High <19 Years 150 Years 150 Years <15 days <1 Year <19 Years 150 Years 150 Years 150 Years 150 Years 150 Years 150 years 150 Years 309 163 192 157 130 125 0 0.5 0.0 <100 100 130 160 >=190 4 8 0.6 2.0 2.0 2.1 1.6 2.0 70 none 0 0 none 1222 452 321 283 250 220 225 2.2 2.8 0 19 Years 0 0 15 days 1 Year 19 Years 0 0 0 0 0 0 none 0 0 10 2 Years Serum range 10 10 20 F 50/M 40 F 33/M 22 129 159 189 0 0 <15 days <13 wks <1 Year <19 Years 150 Years 0 15 days 1 Year 10 Years 15 Years 19 Years 0 0 0 Consensus 0 ‐ 150 yrs Microalbumin Urine (Timed) (mg/day)
Opiate Immunoassay Urine (ng/mL)
0 15 days 13 wks 1 Year 19 Years 220 mEq/L 260 mEq/day 129 159 189 39 78 1.2 3.9 3.1 2.8 2.6 20 120 none 14.9 29.9 none 0 150 yrs none 0 14 days 5.6 15 days <1 Year 4.8 1 Year <5 Years 4.3 5 Years <13 Years 4.1 13 Years M/F <16 Years M/F 3.2 16 Years <19 Years 2.9 19 Years 150 Years 2.3 0 150 Years 20 0 150 Years 400 Newborn, 0 30 days 3.7 Comment <3 days: Premature 0 ‐ 48 hr range is 3.0 ‐ 6.0 Infant 30 days <1 Year 4.1 Child 1 Year <12 Years 3.4 Plasma 12 Years 150 Years 3.3 Comment: Serum reference range is higher 3.5 ‐ 5.1 mmol/L 0 150 Years 25 0 150 Years 25 0 <15 days 2 15 days <1 year 5 1 Year <5 Years 12 5 Years <13 Years 14 13 Years <16 Years 18 16 Years <19 Years M/F 17 19 Years <60 Years M/F 16 60 Years 150 Years M/F 14 newborn, 0 1 month 40 Comment < 1 month: Premature range is 15 ‐ 130 General, 1 mo 150 Years 15 none 10.5 8.4 6.8 5.9 6.2 5 4.7 150 1300 5.9 0 150 Years none 0 150 Years 0 0 150 Years 0 0 150 Years 1.5 0 <19 Years 9 19 Years 150 Years 0 0 150 Years 15 Comment: Potentially toxic range is >30 Neonate, 0 <30 days 133 Comment neonates: Premature <48 hour range is 128 ‐ 148 mmol/L Infant 1 month <1 Year 139 Child 1 year <18 Years 138 Adult 18 years 150 Years 136 0 150 Years 40 mmol/L 0 150 Years 40 mmol/day none 14.9 299 5 17 <30 30 5.3 4.7 4.8 125 125 12 24 23 26 31 35 45 42 120 40 146 146 145 144 220 mmol/L 220 mmol/day Department of Pathology, Microbiology and Immunology Core Laboratory
New Automation Instrumentation Reference Ranges Test Name Current Reference Range New Reference Range Protein Level (g/dL)
Infant Peak PEAK Adult Trough Infant/Peds Trough Adult Toxic Trough Peds Toxic Trough Infant Toxic Trough Adult 0 0 150 Years 150 Years 2‐4 mg/Kg = 5‐10 mcg/mL
5‐10 mcg/mL <2 mcg/mL <0.5 mcg/mL Q24 > 1 mcg/mL Q24 > 2 mcg/mL Q24 > 0.5 mcg/mL 250 6.1 Transferrin (mg/dL)
0 150 Years 212 Tricyclic Antidepressants
Immunoassay (ng/mL)
Triglycerides (mg/dL)
0 150 Years none none 0 150 Years none none 0 150 Years none 149 (Consensus) 0 150 Years 0 149 BUN (mg/dL)
0 150 Years 5 25 0 0 0 2 Years 150 Years 150 Years 2 Years 12 Years Tobramycin Level (mcg/mL)
Iron Binding Capacity Total (mcg/dL)
Urea Urine (Spot) (mg/dL)
Urea Urine (Timed) (g/day)
Uric Acid (mg/dL)
Uric Acid Urine (Spot) (mg/dL)
Uric Acid Urine (Timed) (mg/day)
Tacrolimus Cyclosporin (ng/mL) Sirolimus Carbamazepine Level (mcg/mL)
Digoxin Level (ng/mL)
Gentamicin Level Lidocaine Level (mcg/mL) Methotrexate Level (micromol/L) Phenobarbital Level (mcg/mL)
Phenytoin Level Total (mcg/mL)
Phenytoin Level Free (mcg/mL) Primidone Level mcg/mL Procainamide (mcg/mL) NAPA Level (mcg/mL) Theophylline Level (mcg/mL)
Valproic Acid Level (mcg/mL)
Valproic Acid Free (mcg/mL) Vancomycin Level (mcg/mL)
AFP TUMOR (ng/mL) Beta hCG Quantitative (mIU/mL)
12 Years 0 0 0 0 0 0 0 Infant Peak PEAK Adult Trough Infant/Peds Trough Adult Toxic Trough Peds Toxic Trough Infant Toxic Trough Adult 0 0 0 0 150 Years 150 Years 150 Years 150 Years 150 Years 150 Years 150 Years 150 Years 0 0 0 0 0 0 0 150 Years 150 Years 150 Years 150 Years 150 Years 150 Years 150 Years 150 Years 150 yrs 150 yrs 150 yrs 0 150 Years 0 150 Years Infant/peds Peak PEAK Adult Trough Infant/Peds Trough Adult Toxic Trough Infant/Peds Toxic Trough Adult Toxic Peak Adult/Infant/peds 0 13 days 14 30 days 1 mo 2 months 2 mo 3 months 3 mo 4 months 4 Months 5 months 5 months 6 months 6 months 1 year 1 year 2 years 2 years 3 years 3 years 150 years 0 150 Years 0 Fasting 0 150 Years 150 years CA 125 (U/ml)
0 150 Years CEA (ng/mL)
0 0 150 Years 150 Years B-Type Natriuretic Peptide (pg/mL)
C‐Peptide (ng/mL) CK-MB (ng/mL)
5‐7 mg/kg = >15 mcg/mL Infant Peak 2‐4 mg/Kg = 5‐10 mcg/mL 5‐7 mg/kg = >15 mcg/mL PEAK Adult 5‐10 mcg/mL Trough Infant/Peds <2 mcg/mL Trough Adult <0.5 mcg/mL Q8/Q12 >2 mcg/mL Toxic Trough Peds Q24 > 1 mcg/mL Q8/Q12 >2 mcg/mL Q8/Q12 >2 mcg/mL Toxic Trough Infant Q24 > 2 mcg/mL Q8/Q12 >2 mcg/mL Q8/Q12 >2 mcg/mL Toxic Trough Adult Q24 > 0.5 mcg/mL Q8/Q12 >2 mcg/mL 450 0 150 Years 250 450 8.4 0 <15 days 5.3 8.3 15 days <1 Year 4.4 7.1 1 Year <6 Years 6.1 7.5 6 Years <9 Years 6.4 7.7 9 Years <19 Years 6.5 8.1 19 Years 150 Years 6 8.3 Comment: Serum reference ranges are shown, please note that plasma samples are 0.3 ‐ 0.5 g/dL higher than serum 360 0 <9 wks 104 224 9 wks <1 Year 107 324 1 Year <19 Years 220 337 19 Years <60 Years M/F 174 382 60 Years 150 Years M/F 163 360 0 <15 days 3 23 15 days <1 Year 3 17 1 Year <10 Years 9 22 10 Years <19 Years M/F 7 21 19 Years <50 Years M/F 7 21 50 Years 150 Years M/F 8 26 300 1800 mg/dL 0 150 Years 300 1800 6 17 g/day 0 150 Years 6 20 2.0 7.0 0 14 days 2.8 12.7 2.0 6.5 15 days <1 Year 1.6 6.3 1 Year <12 Years 1.8 4.9 12 Years <19 Years 2.6 F 5.9/M 7.6 2.0 7.0 19 Years 150 Years F 2.6/ M 3.5 F 6.0/M 7.2 20 100 0 150 Years 20 100 250 800 0 150 Years 250 800 Organ specific reference ranges apply
none none 0 150 Years 100 300 0 150 Years 100 300 Organ specific reference ranges apply
none none 0 150 Years 4.0 12.0 0 150 Years 4 12 0.80 2.00 0 150 Years 0.8 2 2‐4 mg/Kg = 5‐10 mcg/mL
5‐7 mg/kg = >15 mcg/mL Infant Peak 2‐4 mg/Kg = 5‐10 mcg/mL 5‐7 mg/kg = >15 mcg/mL 5‐10 mcg/mL PEAK Adult 5‐10 mcg/mL <2 mcg/mL Trough Infant/Peds <2 mcg/mL <0.5 mcg/mL Trough Adult <0.5 mcg/mL Q24 > 1 mcg/mL Q8/Q12 >2 mcg/mL Toxic Trough Peds Q24 > 1 mcg/mL Q8/Q12 >2 mcg/mL Q24 > 2 mcg/mL Q8/Q12 >2 mcg/mL Toxic Trough Infant Q24 > 2 mcg/mL Q8/Q12 >2 mcg/mL Q24 > 0.5 mcg/mL Q8/Q12 >2 mcg/mL Toxic Trough Adult Q24 > 0.5 mcg/mL Q8/Q12 >2 mcg/mL 1.5 5.0 0 150 Years 1.5 5.0 24 hr post infusion <5.0 0 150 Years 24 hr post infusion <5.0 48 hrs post infusion <0.50 0 150 Years 48 hrs post infusion <0.50 72 hrs post infusion <0.10 0 150 Years 72 hrs post infusion <0.10 Negative LLOQ <0.04 Negative LLOQ <0.04 15.0 40.0 0 150 Years 10 40 10.0 25.0 0 150 Years 10 20 0.8 2.0 0 150 Years 0.8 2.0 5.0 15.0 0 150 Years 5.0 12.0 4.0 10.0 0 150 Years 4.0 10.0 10.0 30.0 0 150 Years 5.0 30.0 10.0 20.0 (Neonates) 0 <1 month 5 10 1 month 150 Years 10 20 50 100 0 150 Years 50 100 6 20 0 150 Years 6 20 25‐50 mcg/mL Infant/peds Peak 25‐50 mcg/mL 20‐40 mcg/mL PEAK Adult 20‐40 mcg/mL 5‐20 mcg/mL Trough Infant/Peds 5‐20 mcg/mL 10‐20 mcg/mL Trough Adult 10‐20 mcg/mL >25 mcg/mL Toxic Trough Infant/Peds >25 mcg/mL > 20 mcg/mL Toxic Trough Adult > 20 mcg/mL > 50 mcg/mL Toxic Peak Adult/Infant/peds > 50 mcg/mL 5000 105,000 0 13 days 5000 105,000 300 60000 14 30 days 300 60000 100 10,000 1 mo 2 months 100 10,000 40 1000 2 mo 3 months 40 1000 11 300 3 mo 4 months 11 300 5 200 4 Months 5 months 5 200 0 90 5 months 6 months 0 90 0 97 6 months 1 year 0 97 0 41 1 year 2 years 0 41 0 12 2 years 3 years 0 12 0 9.9 3 years 150 years 0 9.9 0 5 Males 0 70 Years 0 < 2.0 Females 0 55 Years 0 5 5.0 100.0 10 100 0.9 7.1 0 150 Years 0.7 5.2 Note: Reference Range pending validation studies. none 34.9 Females 0 150 Years 0 35 Female only ‐ no male range 0.0 3.0 0 150 Years 0 3 none 5.99 0 150 Years 0 6 Department of Pathology, Microbiology and Immunology Core Laboratory New Automation Instrumentation Reference Ranges Test Name Current Reference Range 8AM ‐ 9 AM Cortisol (mcg/dL)
New Reference Range 10.4 11PM 26.4 25% of 8 ‐ 9AM level 0 (before 10 AM)‐ Interpretive table ‐ no range listed 0 (After 5 PM)‐ Interpretive table no range listed 150 Years 3.7 150 Years 19.4 2.9 17.3 Cystatin C (mg/L)
DHEA-S (mcg/dL)
Estradiol (pg/mL)
0 4 Months 1 Year 18 Years M/F 0 M/F M 18 Years Female 3 Months <1 Year 17 Years 150 Years <30 days Prepubertal 150 Years premenopausal postmenopausal 0.50 0.50 0.50 0.50 0 0 80 35 10 2.00 1.50 1.00 1.10 600 98 560 430 190 M/F Males 18 Years Female Prepubertal 150 Years Follicular Mid‐cycle Luteal Phase 0 0 0 34 27 0 <30 <56 <160 400 246 <30 Postmenopausal Ferritin (ng/mL)
Folate Level (mg/mL)
FSH (mIU/ml)
150 Years 0 Male 18 Years 150 Years 150 years follicular peak Luteal Phase Postmenopausal Female 16 Years Hepatitis B Surface Antibody
Hepatitis B Surface Antigen
Hepatitis B Core Ab Total
Hepatitis C Antibody
Insulin (mcU/mL)
0 0 0 0 0 0 Fasting 0 Hepatitis A Antibody
Hepatitis A IGM Antibody
Male 20 Female 11 5.9 1.0 2.7 3.9 1.0 25 150 Years 150 Years 150 Years 150 Years 150 Years 150 Years 150 Years Female Interpretive table Normal Menstruating Follicular Phase Mid‐Cycle Phase Luteal Phase Postmenopausal 0 300 300 24.8 42.5 mIU/mL 15.4 22.0 14.4 160 Range (pg/mL) 21 ‐ 251 38 ‐ 649 21 ‐ 312 0 ‐ 30 150 Years 150 Years 150 Years 11 months 9 Years 18 Years 150 Years 11 months 10 Years 14 Years 150 Years Range (mIU/mL) Female‐ Interpretive ta
Normal Menstruating Females Follicular Phase 3.0 ‐ 8.0 Mid‐Cycle Peak 2.5 ‐ 17.0 Luteal Phase 1.3 ‐ 5.5 Postmenopausal Femal
25 ‐ 135 <23 Male 0 Female 0 WHO range 0 Male 1 month Male 1 Year Males 10 Years Male 19 Years Female 1 month Female 1 Year Female 11 Years Female 15 Years Nonreactive (negative) Nonreactive (negative) Nonreactive (negative) Nonreactive (negative) Nonreactive (negative) Nonreactive (negative) 0 This will need to be an interpretive table followed by interpretive text that says: "Before 10 AM 3.7 ‐ 19.4 mcg/dL After 5 PM 2.9 ‐ 17.3 The Endocrine Society suggests a cut‐off of < 1.8 mcg/dL 8 hours after 1 mg‐Overnight Dexamethasone Suppression test or 2 hours after the last dose in the Longer Low‐dose Dexamethasone Suppression Test."
0 3 Months 0.50 2.00 4 Months < 1 Year 0.50 1.50 1 Year 17 Years 0.50 1.00 18 Years 150 Years 0.50 1.10 M/F 0 6 days 108 607 M/F 7 Days 30 Days 32 431 M/F 1 Month 5 months 3 124 M/F 6 months 2 Years 0 33 M/F 3 Years 6 Years 0 47 M/F 7 Years 9 Years 5 115 Males 10 Years 14 Years 22 332 Males 15 Years 19 Years 88 483 Males 20 Years 29 Years 280 640 Males 30 Years 49 Years 95 530 Males 50 Years 59 Years 70 310 Males 60 Years 150 Years 28 290 Females 10 Years 14 Years 22 255 Females 15 Years 29 Years 63 380 Females 30 Years 49 Years 32 270 Females 50 Years 59 Years 26 200 Females 60 Years 150 Years 10 Please include Interpetive Table with all results DHEA‐S Result (mcg/dL) Female Male Tanner Stage 7 ‐ 209 7 ‐ 126 I 28 ‐ 260 13‐241 II 39‐390 32‐446 III 81‐488 65‐371 IV&V M/F 15 days 11 months 0 24 Males ‐ 1 year 10 years 0 13 Males ‐ 11 years 14 years 0 28 Males 15 years 18 Years 0 38 Males ‐ 19 Years 150 Years 11 44 Females 1 year 8 years 0 10 Females 9 Years 11 years 0 94 Females 12 years 13‐years 11 172 Females 14 Years 150 Years Please see interpretive table 24 15 5.9 0.1 0 0.4 1 0.5 0.4 0.3 Please see interpretive table 336 204 24.8 2.4 1.6 5.1 12 11 5.5 7.8 0 150 Years Nonreactive (negative) 0 150 Years Nonreactive (negative) 0 150 Years Nonreactive (negative) 0 150 Years Nonreactive (negative) 0 150 Years Nonreactive (negative) 0 150 Years Nonreactive (negative) 0 150 Years 0 16 Note: Reference Range pending validation studies Comment: This test should be measured to establish the pathogenesis of fasting hypoglycemia. The NACB guidelines suggest that there is no role for routine insulin in most diabetic patients. Diabetes Care 34:e61‐e99,2011. Patients receiving insulin therapy may develop anti‐insulin antibodies which could interfere with the assay. This assay shows nearly equimolar cross reactivity (75‐150%) with recombinant human insulin (Actrapid and humulin) and insulin analogs (detemir, aspart, glargine and lispro). Department of Pathology, Microbiology and Immunology Core Laboratory New Automation Instrumentation Reference Ranges Test Name Current Reference Range Male 18 Years LH (mIU/mL)
150 years follicular peak luteal Phase Female 16 Years Postmenopausal Progesterone (ng/mL) 150 Years 10 M/F 0 M/F 3 months Female <3 months prepubertal follicular luteal Phase postmenopausal 150 years 0 0 0 2.5 0 0 Male 18 Years 15.1 16.6 69 14.9 70 150 Years 150 Years 0.10 interpretive table 0 0 0 0 0.6 See Interpretive Table Range (mIU/mL) Female‐ Interpretive ta
Normal Menstruating Females Follicular Phase 1.8 ‐ 11.8 Mid‐Cycle Peak 7.0 ‐ 89 Luteal Phase 0.5 ‐ 14 Postmenopausal Femal
5.0 ‐ 62 2.9 <0.5 4.3 6.4 12 1 Year 8 Years 16 9 Years 16 Years 22 17 Years 18 Years 17 19 Years 150 Years 9 Note: Pediatric Reference Ranges only verified for serum, see CALIPER Study at CaliperDatabase.com 17 M/F 1 month 11 months 0 <1.0 M/F ‐ 1 year 9 years 0 <1.5 M/F ‐10 years 14 years 0.1 25.0 Male‐15 years Male ‐ 18 years 0.1 <1.0 Male ‐ 18 years 150 years 0 <1.0 Please see interpretive table Females ‐ 15 Years 150 Years Male 0 0 11 months 9 Years 12 Years 14 Years 150 Years 150 Years 65 Prostate Specific Antigen (ng/mL)
Prostate Specific Ag Total and Free
M/F 3 months M/F 1 Year M/F 10 Years M/F 13 Years Males 15 Years Females 15 Years 0 Parathyroid Hormone Level (pg/mL)
New Reference Range 0.3 0.6 7.6 0 10 Female Range Interpretive table (ng/mL) Normal Menstruating Female Follicular Phase < 0.3 Luteal Phase 1.2 ‐ 15.9 Postmenopausal Female < 0.2 63 88 60 77 0.7 0.3 0.8 0.6 0.2 Note: Pediatric Reference Ranges only verified for serum, see CALIPER Study at CaliperDatabase.com 4.00 0 80 Years 0.05 Interpretive Table in Cerner with all test results 4 Note: PSA screening is recommended for patients 75 years and younger In patients with total PSA between 4 ‐ 10 ng/mL and a negative digital rectal exam, % Free PSA < 10 ng/mL 10 ‐ 15 ng/mL Probability of Prostate 1
Cancer (%) 48.6
15‐20 ng/mL 37.1
20‐26 ng/mL 26.9
>26 ng/mL 18.6
12.5
1
Assumes an overall prevalence of 29% for Prostate Cancer in the tested population Prolactin (ng/mL) Male 0 Female 150 Years premenopausal Males 0 Female 0 150 Years 150 Years 0 0 0 2.00 0.10 T4 (mcg/dL)
0 150 Years 4.0 Thyroxine, Free (ng/dL)
0 150 Years 0.50 Thyroid Stimulating Hormone
(mcU/mL)
0 150 Years 0.30 postmenopausal Testosterone Level Total (ng/dL) Triiodothyronine Level Total (ng/dL)
Troponin-I (ng/mL)
Vitamin B12 Level (pg/mL) Vitamin D (ng/mL)
<15 <20 <12 11.00 0.60 Male 0 Female 0 150 Years 150 Years 3.46 3 19.4 27 Males 21 Years 49 Years 47.01 980.56 Males 50 Years 150 Years 127.18 1020.36 Females 21 Years 49 Years 7.21 79.31 Females 50 Years 150 Years 8.65 36.92 12.0 1 Year 8 Years 6.16 10.32 9 Years 11 Years 5.48 9.31 12 Years 16 Years 4.68 8.62 17 Years 150 Years 4.6 11.72 Note: Pediatric Reference Ranges only verified for serum, see CALIPER Study at CaliperDatabase.com 1.20 0 <1 Year no range, will add based on new CALIPER data 1 Year 18 Years 0.89 1.37 19 Years 150 Years 0.7 1.48 Note: Pediatric Reference Ranges only verified for serum, see CALIPER Study at CaliperDatabase.com 5.00 1 Year 13 Years 0.73 14 Years 18 Years 0.47 19 Years 150 Years 0.35 Note: Pediatric Reference Ranges only verified for serum, see CALIPER Study at CaliperDatabase.com 0 150 Years 80 200 1 Year 11 Years 113 12 Years 14 Years 98 15 Years 16 Years 92 17 Years 18 Years 104 19 Years 150 Years 58 Note: Pediatric Reference Ranges only verified for serum, see CALIPER Study at CaliperDatabase.com 0 150 Years none 0.04 0 150 Years 0 Comment: "Reference values have not been established for patients < 17 years old." 0 150 Years 180 1000 0 150 Years 213 Deficiency 0 < 10 0 ‐ 150 Years Deficiency 0 Insufficiency 10 25 Insufficiency 10 Sufficiency 25 80 Sufficiency 25 Toxicity >80 Toxicity Note: a pediatric range has not been established for this test Note: a pediatric range has not been established for this test 4.09 3.41 3.6 189 176 156 135 160 0.03 816 < 10 25 80 >80 Department of Pathology, Microbiology and Immunology Core Laboratory New Automation Instrumentation Reference Ranges Test Name Albumin Level Body Fluid
Amylase Level Body Fluid
Urea Nitrogen Body Fluid
Calcium Level Body Fluid
Cholesterol Body Fluid
Creatinine Body Fluid
Glucose Body Fluid
Lactate Dehydrogenase Body Fluid
Lipase Level Body Fluid
Potassium Level Body Fluid
Sodium Level Body Fluid
BilirubinTotal Level Body Fluid
Triglyceride Body Fluid
Uric Acid Body Fluid
Carcinoembryonic Antigen Body Fluid
Thyroid Stimulating Hormone Body
Fluid
Beta-HCG Body Fluid
Free T4 Body Fluid
Current Reference Range New Reference Range 0 0 0 0 0 0 0 0 0 0 0 0 0 0 0 150 Years 150 Years 150 Years 150 Years 150 Years 150 Years 150 Years 150 Years 150 Years 150 Years 150 Years 150 Years 150 Years 150 Years 150 Years none none none none none none none none none none none none none none none none none none none none none none none none none none none none none none 0 0 0 0 0 0 0 0 0 0 0 0 0 0 0 150 Years 150 Years 150 Years 150 Years 150 Years 150 Years 150 Years 150 Years 150 Years 150 Years 150 Years 150 Years 150 Years 150 Years 150 Years none none none none none none none none none none none none none none none none none none none none none none none none none none none none none none 0 0 0 150 Years 150 Years 150 Years none none none none none none 0 0 0 150 Years 150 Years 150 Years none none none none none none