Document 12916670
advertisement

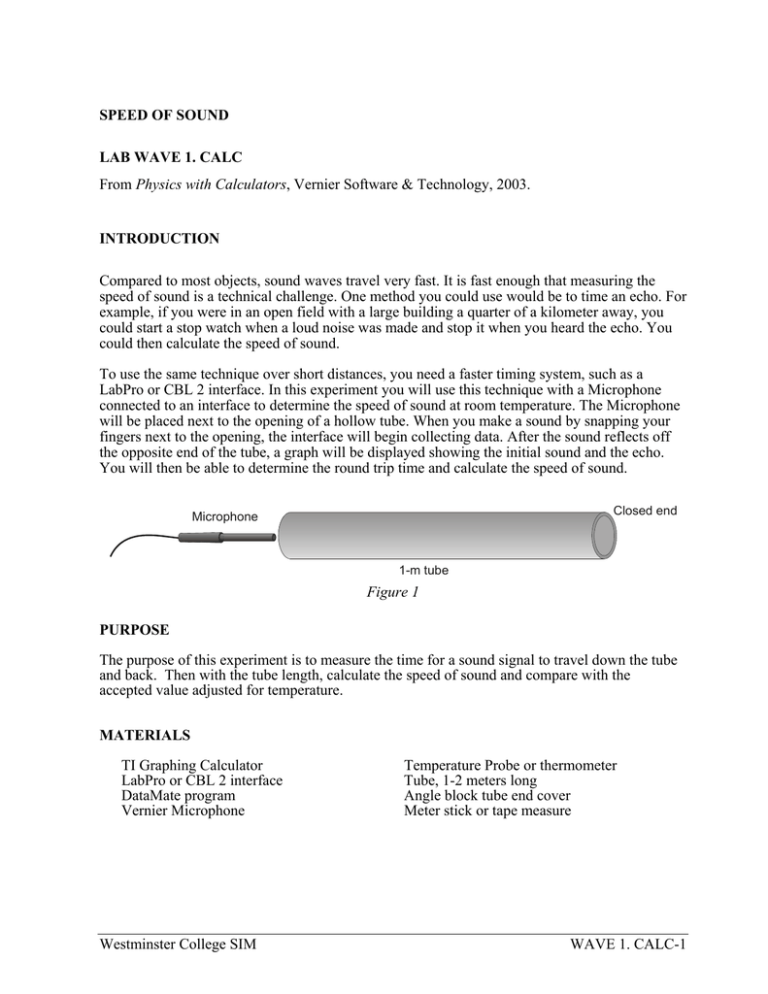
SPEED OF SOUND LAB WAVE 1. CALC From Physics with Calculators, Vernier Software & Technology, 2003. INTRODUCTION Compared to most objects, sound waves travel very fast. It is fast enough that measuring the speed of sound is a technical challenge. One method you could use would be to time an echo. For example, if you were in an open field with a large building a quarter of a kilometer away, you could start a stop watch when a loud noise was made and stop it when you heard the echo. You could then calculate the speed of sound. To use the same technique over short distances, you need a faster timing system, such as a LabPro or CBL 2 interface. In this experiment you will use this technique with a Microphone connected to an interface to determine the speed of sound at room temperature. The Microphone will be placed next to the opening of a hollow tube. When you make a sound by snapping your fingers next to the opening, the interface will begin collecting data. After the sound reflects off the opposite end of the tube, a graph will be displayed showing the initial sound and the echo. You will then be able to determine the round trip time and calculate the speed of sound. Closed end Microphone 1-m tube Figure 1 PURPOSE The purpose of this experiment is to measure the time for a sound signal to travel down the tube and back. Then with the tube length, calculate the speed of sound and compare with the accepted value adjusted for temperature. MATERIALS TI Graphing Calculator LabPro or CBL 2 interface DataMate program Vernier Microphone Westminster College SIM Temperature Probe or thermometer Tube, 1-2 meters long Angle block tube end cover Meter stick or tape measure WAVE 1. CALC-1 Speed of Sound PRELIMINARY QUESTION 1. A common way to measure the distance to lightning is to start counting, one count per second, as soon as you see the flash. Stop counting when you hear the thunder and divide by five to get the distance in miles. Use this information to estimate the speed of sound in m/s. PROCEDURE 1. Use the Temperature Probe or thermometer to measure the air temperature of the classroom. To do this, connect a Temperature Probe to the Channel 1 input on the LabPro or CBL 2 interface. Use the black link cable to connect the interface to the TI Graphing Calculator. Firmly press in the cable ends. 2. Turn on the calculator and start the DATAMATE program. Press CLEAR to reset the program. 3. If the calculator displays a Temperature Probe in CH 1, proceed directly to Step 4. Otherwise, set up the calculator and interface for the Temperature Probe. a. b. c. d. e. Select SETUP from the main screen. Press ENTER to select CH 1. Select TEMPERATURE from the SELECT SENSOR menu. Select the Temperature Probe you are using (in °C) from the TEMPERATURE menu. Select OK to return to the main screen. 4. The temperature will be displayed on the calculator screen. With the tip of the Temperature Probe in open air, away from sunlight, wait until the readings become stable. Variations in the tenths digit are not important. Record the room temperature in your Data Table. 5. Disconnect the Temperature Probe and connect the Vernier Microphone to the Channel 1 input on the interface. Press CLEAR to reset the program. 6. Set up the calculator and interface for the Microphone. a. Select SETUP from the main screen. b. If the calculator displays a Microphone in CH 1, proceed directly to the following step. If it does not, continue with this step to set up your sensor manually. c. Press ENTER to select CH 1. d. Choose MICROPHONE from the SELECT SENSOR list. e. Select CBL, ULI, or MPLI, according to the type of microphone you are using. 7. Set up the interface to trigger on the first loud sound the Microphone detects. a. b. c. d. e. f. g. Press once to select MODE and press ENTER . Select TIME GRAPH from the SELECT MODE screen. Select ADVANCED from TIME GRAPH SETTINGS. Select CHANGE TRIGGERING from ADV. TIME GRAPH SETTINGS. Select CH1-MICROPHONE from SELECT TRIGGERING. Select INCREASING from TRIGGER TYPE. Enter “0.1” for a trigger threshold. End this and all other numeric entries with ENTER . (Use “2.6” if you are using a ULI or CBL microphone. For us, a 2.73 setting worked well.) Westminster College SIM WAVE 1. CALC-2 Speed of Sound h. Enter “0” for the prestore. i. Select OK three times to return to the main screen. 8. Close the end of the tube with the angle block, if provided. (This could be done by inserting a plug or standing a book against the end so it is sealed.) Measure the length of the tube and record in the Data Table. 9. Place the Microphone as close to the end of the long tube as possible, as shown in Figure 2. Position the Microphone so that it can detect the initial sound and the echo coming back down the tube. Open end of tube Microphone 10. Select START to begin data collection. Snap your fingers near the opening of the tube. You can instead clap your hands or strike two pieces of wood together. This sharp sound will trigger the interface to begin collecting data. Figure 2 11. If you are successful, the graph will resemble the one in Figure 3. You may not see a third reflection. In this figure each of three highest peaks corresponds to the same point on a waveform. The first peak is the initial sound, the second is the first reflection, and the third is a second reflection. Repeat your run if necessary by pressing ENTER and returning to the previous step. Use the cursor keys to trace across the graph. Determine the time interval between the start of the first vibration and the start of the echo vibration. Record these two times in your Data Table. Figure 3 12. Repeat the measurement for a total of five trials. DATA TABLE Trial Length of tube m Temperature of room °C Time of Direct Sound Start (s) Time of Echo Start (s) Time Interval (s) 1 2 3 4 5 Average Speed (m/s) Westminster College SIM WAVE 1. CALC-3 Speed of Sound ANALYSIS 1. From the time-pairs you recorded in the Data Table, calculate the differences to find the time interval, and then calculate the average time interval. 2. Calculate the speed of sound. Remember that your average time interval represents the time for sound to travel down the tube and back. 3. The accepted speed of sound at atmospheric pressure and 0 °C is 331.5 m/s. The speed of sound increases 0.607 m/s for every Celsius degree. Calculate the speed of sound at the temperature of your room and compare your measured value to the accepted value. EXTENSIONS 1. Repeat this experiment, but collect data using a tube with an open end. How do the reflected waves for the closed-end tube compare to the reflections with an open-end tube? It might be easier to see any changes by striking a rubber stopper held next to the opening instead of snapping your fingers. Explain any differences. Calculate the speed of sound and compare it to the results with a tube with a closed end. 2. This experiment can be performed without a tube. You need an area with a smooth surface. Multiple reflections may result (floor, ceiling, windows, etc.), adding to the complexity of the recorded data. 3. Fill a tube with another gas, such as carbon dioxide or helium. Be sure to flush the air out with the experimental gas. For heavier-than-air gases, such as carbon dioxide, orient the tube vertically and use a sealed lower end. Invert the tube for lighter-than-air gases. 4. Use this technique to measure the speed of sound in air at different temperatures. 5. Develop a method for measuring the speed of sound in a medium that is not a gas. Westminster College SIM WAVE 1. CALC-4


