Middle Tennessee State University National Study of Learning, Voting, and Engagement (NSLVE) Student Voting Rates for OPEID # 003510.00
advertisement
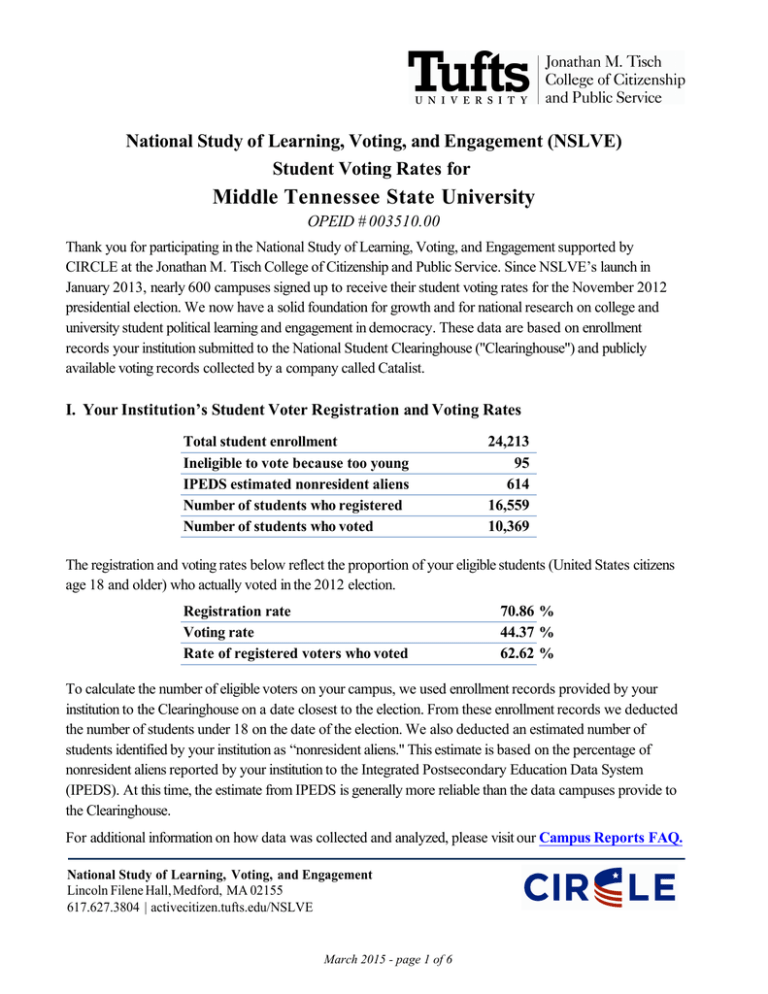
National Study of Learning, Voting, and Engagement (NSLVE) Student Voting Rates for Middle Tennessee State University OPEID # 003510.00 Thank you for participating in the National Study of Learning, Voting, and Engagement supported by CIRCLE at the Jonathan M. Tisch College of Citizenship and Public Service. Since NSLVE’s launch in January 2013, nearly 600 campuses signed up to receive their student voting rates for the November 2012 presidential election. We now have a solid foundation for growth and for national research on college and university student political learning and engagement in democracy. These data are based on enrollment records your institution submitted to the National Student Clearinghouse ("Clearinghouse") and publicly available voting records collected by a company called Catalist. I. Your Institution’s Student Voter Registration and Voting Rates Total student enrollment Ineligible to vote because too young IPEDS estimated nonresident aliens Number of students who registered Number of students who voted 24,213 95 614 16,559 10,369 The registration and voting rates below reflect the proportion of your eligible students (United States citizens age 18 and older) who actually voted in the 2012 election. Registration rate Voting rate Rate of registered voters who voted 70.86 % 44.37 % 62.62 % To calculate the number of eligible voters on your campus, we used enrollment records provided by your institution to the Clearinghouse on a date closest to the election. From these enrollment records we deducted the number of students under 18 on the date of the election. We also deducted an estimated number of students identified by your institution as “nonresident aliens." This estimate is based on the percentage of nonresident aliens reported by your institution to the Integrated Postsecondary Education Data System (IPEDS). At this time, the estimate from IPEDS is generally more reliable than the data campuses provide to the Clearinghouse. For additional information on how data was collected and analyzed, please visit our Campus Reports FAQ. National Study of Learning, Voting, and Engagement Lincoln Filene Hall,Medford, MA 02155 617.627.3804 | activecitizen.tufts.edu/NSLVE March 2015 - page 1 of 6 National Study of Learning, Voting, and Engagement Lincoln Filene Hall,Medford, MA 02155 617.627.3804 | activecitizen.tufts.edu/NSLVE How precise are the estimates? Catalist collects actual registration and voting records nationally. Using these records removes the sources of error that can arise from most other efforts to calculate voting rates such as sampling or response bias. However, some sources of error are still possible: 1) Some of your students might have blocked their records from being used for any purpose, including research. If those students voted at a much lower or higher rate than your other students, it would affect the voting rate. The number of records blocked for your campus: 134 2) When combining two datasets, matching errors can occur. It is possible that some students could not be identified in the public voting records using the name and address combination in the Clearinghouse student records. We do receive “confidence scores” for each matched record, and the average confidence score for these records is 96.6%. Students not found in the voting database are considered non-voters. A matching error can result in your actual voting rate being higher than we report. 3) No national database exists reflecting the number of resident aliens (non-US citizens living permanently in the US) attending colleges and universities. We cannot adjust for these non-citizens. If you know this number, see our Campus Report FAQ for steps you can take to adjust your rate. As you review the report, please note: An "n/a" indicates that data is not available because your campus either: 1) does not submit this information to the Clearinghouse, 2) does not have students that meet a criteria, or 3) has less than ten students that meet a criteria. To protect student privacy, we do not report values that are less than ten. In the charts below, we label these values with a "*". II. Student Attributes Class Level and Age: Your students, broken down by undergraduate and graduate levels, voted at the following rates. Please note that we are not able to adjust these voting rates by removing non-resident aliens. Class Level 20000 18000 16000 14000 12000 10000 8000 6000 4000 2000 0 18161 Enrolled 7567 Voted 2691 1502 3132 1300 Undergrad Graduate Unknown 41.7% 55.8% 41.5% % Reflects Voting Rate March 2015 - page 2 of 6 Your students, broken down by age groups, voted at the following rates: Age Categories 12000 11222 10000 8000 5721 6000 4000 Enrolled 4251 2346 3106 2000 Voted 2490 1382 0 1372 1053 730 392 288 n/a n/a 18-21 22-24 25-29 30-39 40-49 50+ Unknown 37.9% 41.0% 44.5% 55.1% 69.3% 73.5% n/a % Reflects Voting Rate Gender, Race/Ethnicity: Some campuses provide gender and race/ethnicity to the Clearinghouse and for those, we can break down the rates by social identity. If the race/ethnicity or gender of your students is “unknown” below, then your institution does not provide that information the Clearinghouse. Please see our Campus Reports FAQ for recommendations on how to improve your data. Gender 30000 23984 25000 20000 15000 10369 10000 Voted 5000 0 Enrolled n/a n/a n/a n/a Female Male Unknown n/a n/a 43.2% % Reflects Voting Rate March 2015 - page 3 of 6 Race & Ethnicity 30000 23984 25000 20000 15000 Enrolled 10369 10000 Voted 5000 0 n/a n/a n/a n/a n/a n/a n/a n/a n/a n/a n/a n/a n/a n/a Asian Amer. Indian / Native Alaskan Black Hispanic Native Hawaiian / Pacific Isl. White 2 or More Race Unknown n/a n/a n/a n/a n/a n/a n/a 43.2% % Reflects Voting Rate III. Field of Study Broken down by field of study, your students voted at the following rates (note: values less than ten are designated with an "n/a*"): Combined Fields of Study Enrolled Business, Management, Marketing, and Related Support 3406 Liberal Arts and Sciences, General Studies, and Humanities 1380 Health Professions and Related Sciences, Knowledge and Skills 1663 Biological and Biomedical Sciences 892 Social Sciences 802 Education 2421 Engineering n/a* Psychology, Personal Awareness, and Self-Improvement 1182 Visual and Performing Arts 2367 Communication, Journalism, and Related Programs 1375 Multi/Interdisciplinary Studies 1248 Humanities 1175 Computer, Information, and Library Sciences 419 Physical Sciences 328 Professions 416 Trades 2202 Mathematics and Statistics 261 Parks and Recreation 1095 Agriculture, Agriculture Operations, and Related Sciences 539 Technologies/Technicians 715 March 2015 - page 4 of 6 Voted 1418 650 782 374 379 1351 n/a* 511 775 575 491 574 162 136 230 886 97 456 236 239 Turnout 41.6% 47.1% 47.0% 41.9% 47.3% 55.8% n/a 43.2% 32.7% 41.8% 39.3% 48.9% 38.7% 41.5% 55.3% 40.2% 37.2% 41.6% 43.8% 33.4% IV. Voting Method Of your students who voted, they voted by the following methods: Voting Method Unknown 1% In-person, Election Day 44% Mail 0% Early Vote 51% Absentee 4% 0% 50% 100% Note: If your campus has a high percentage of unknown voting method, this information is not reported by local officals. V. Peer Comparison We invite you to view your peer comparison data by visiting this Comparison Group Resource. On this page, you will find average voting rates broken down by Carnegie Classification. VI. Placing Your Numbers in Context Before NSLVE, college student voting could only be examined through surveys, including the U.S. Census Bureaus’s Current Population Survey (CPS). Relying on CPS data has some limitations. First, the Census’ measures of voting are self-reported, which may influence the accuracy of the data (e.g., some survey respondents may say they voted when they did not). Second, the Census is a sample of the U.S. population, and sampling always introduces some random error. Third, the Census does not ask individuals 25 and older whether they are currently enrolled in college. With these caveats in mind, these are the 2012 voting and registration trends for college students under age 25 since 1984, according to CPS: March 2015 - page 5 of 6 Additional voting facts (CIRCLE Staff, 2013) ● Age matters, and young people vote at far lower rates than older cohorts. ● Young women are consistently more likely to vote than young men. In 2012, women voted 7 percentage points higher than men. ● In 2012, youth voting was highest in battleground states, showing that youth respond to increased political activity and being asked to vote. ● Participation in the 2012 election differed by race and ethnicity. Young Black and African Americans voted at the highest rate among any racial or ethnic group in 2012, at a rate of 53.7%. VII. Looking Ahead We continue to recruit additional campuses to build the national database and to provide more robust comparison groups. Please reach out to your peer institutions and invite them to participate in NSLVE. We will analzye 2014 voting data in May 2015, after which you will receive another report. In the meantime, we are analyzing data we collected from our case studies on campus climate for political learning and engagement in democracy. These case studies represent institutionally and geographically diverse campuses. We are examining relationships between voting rates and graduation rates, civic learning opportunities on campus, and how these correlations vary by gender, socioeconomic status and race. We are also studying relationships between in-state versus out-of-state students, where students are registered, and voting outcomes. This will allow us to see whether location plays a role in voting rates. As the number of participating campuses continues to grow, we will analyze voting trends and relationships based on geography, institutional mission and student populations served. We will be looking for additional comparisons and publishing these findings. We welcome your suggestions for improving NSLVE and for using the data. Please send comments to: NSLVE@tufts.edu References CIRCLE Staff (2013). “The Youth Vote in 2012,” CIRCLE Fact Sheet (Medford, MA: Center for Information and Research on Civic Learning and Engagement, 2013), at: http://www.civicyouth.org/?p=5603. March 2015 - page 6 of 6
