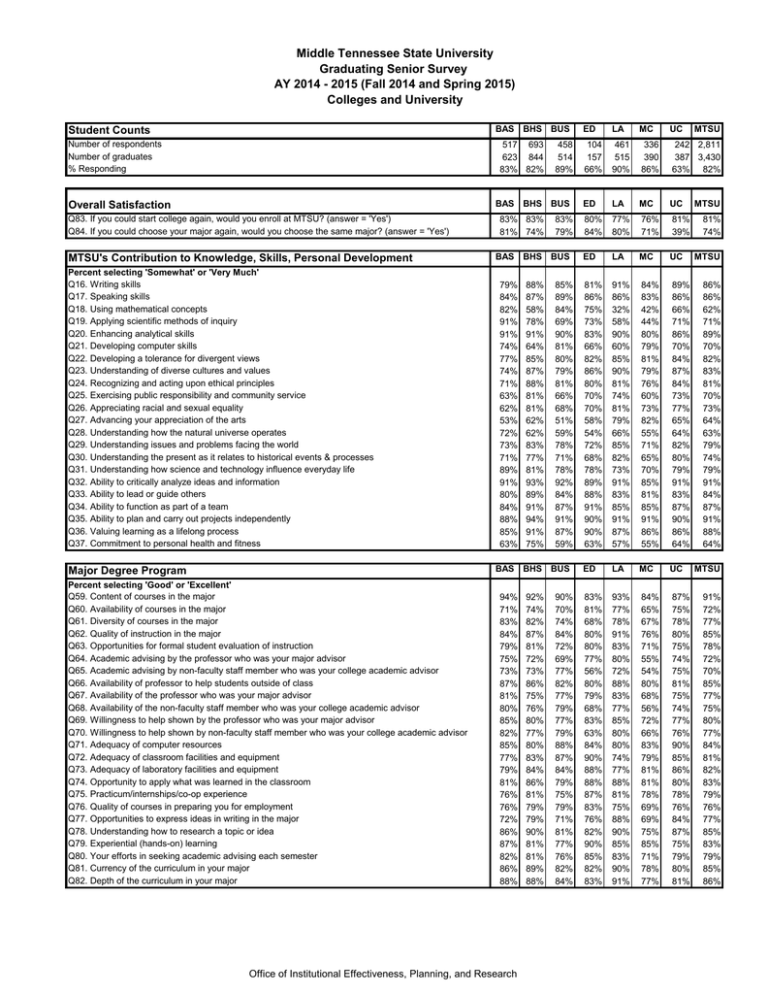
Student Counts
advertisement

Middle Tennessee State University Graduating Senior Survey AY 2014 - 2015 (Fall 2014 and Spring 2015) Colleges and University BAS BHS BUS Student Counts Number of respondents Number of graduates % Responding 517 693 623 844 83% 82% 458 514 89% BAS BHS BUS Overall Satisfaction Q83. If you could start college again, would you enroll at MTSU? (answer = 'Yes') Q84. If you could choose your major again, would you choose the same major? (answer = 'Yes') MTSU's Contribution to Knowledge, Skills, Personal Development Percent selecting 'Somewhat' or 'Very Much' Q16. Writing skills Q17. Speaking skills Q18. Using mathematical concepts Q19. Applying scientific methods of inquiry Q20. Enhancing analytical skills Q21. Developing computer skills Q22. Developing a tolerance for divergent views Q23. Understanding of diverse cultures and values Q24. Recognizing and acting upon ethical principles Q25. Exercising public responsibility and community service Q26. Appreciating racial and sexual equality Q27. Advancing your appreciation of the arts Q28. Understanding how the natural universe operates Q29. Understanding issues and problems facing the world Q30. Understanding the present as it relates to historical events & processes Q31. Understanding how science and technology influence everyday life Q32. Ability to critically analyze ideas and information Q33. Ability to lead or guide others Q34. Ability to function as part of a team Q35. Ability to plan and carry out projects independently Q36. Valuing learning as a lifelong process Q37. Commitment to personal health and fitness 83% 83% 81% 74% 83% 79% BAS BHS BUS 79% 84% 82% 91% 91% 74% 77% 74% 71% 63% 62% 53% 72% 73% 71% 89% 91% 80% 84% 88% 85% 63% 88% 87% 58% 78% 91% 64% 85% 87% 88% 81% 81% 62% 62% 83% 77% 81% 93% 89% 91% 94% 91% 75% 85% 89% 84% 69% 90% 81% 80% 79% 81% 66% 68% 51% 59% 78% 71% 78% 92% 84% 87% 91% 87% 59% BAS BHS BUS Major Degree Program Percent selecting 'Good' or 'Excellent' Q59. Content of courses in the major Q60. Availability of courses in the major Q61. Diversity of courses in the major Q62. Quality of instruction in the major Q63. Opportunities for formal student evaluation of instruction Q64. Academic advising by the professor who was your major advisor Q65. Academic advising by non-faculty staff member who was your college academic advisor Q66. Availability of professor to help students outside of class Q67. Availability of the professor who was your major advisor Q68. Availability of the non-faculty staff member who was your college academic advisor Q69. Willingness to help shown by the professor who was your major advisor Q70. Willingness to help shown by non-faculty staff member who was your college academic advisor Q71. Adequacy of computer resources Q72. Adequacy of classroom facilities and equipment Q73. Adequacy of laboratory facilities and equipment Q74. Opportunity to apply what was learned in the classroom Q75. Practicum/internships/co-op experience Q76. Quality of courses in preparing you for employment Q77. Opportunities to express ideas in writing in the major Q78. Understanding how to research a topic or idea Q79. Experiential (hands-on) learning Q80. Your efforts in seeking academic advising each semester Q81. Currency of the curriculum in your major Q82. Depth of the curriculum in your major 94% 71% 83% 84% 79% 75% 73% 87% 81% 80% 85% 82% 85% 77% 79% 81% 76% 76% 72% 86% 87% 82% 86% 88% Office of Institutional Effectiveness, Planning, and Research 92% 74% 82% 87% 81% 72% 73% 86% 75% 76% 80% 77% 80% 83% 84% 86% 81% 79% 79% 90% 81% 81% 89% 88% 90% 70% 74% 84% 72% 69% 77% 82% 77% 79% 77% 79% 88% 87% 84% 79% 75% 79% 71% 81% 77% 76% 82% 84% ED LA MC UC 104 157 66% 461 515 90% 336 390 86% 242 2,811 387 3,430 63% 82% MTSU ED LA MC UC 80% 84% 77% 80% 76% 71% 81% 39% ED LA MC UC 81% 86% 75% 73% 83% 66% 82% 86% 80% 70% 70% 58% 54% 72% 68% 78% 89% 88% 91% 90% 90% 63% 91% 86% 32% 58% 90% 60% 85% 90% 81% 74% 81% 79% 66% 85% 82% 73% 91% 83% 85% 91% 87% 57% 84% 83% 42% 44% 80% 79% 81% 79% 76% 60% 73% 82% 55% 71% 65% 70% 85% 81% 85% 91% 86% 55% 89% 86% 66% 71% 86% 70% 84% 87% 84% 73% 77% 65% 64% 82% 80% 79% 91% 83% 87% 90% 86% 64% ED LA MC UC 83% 81% 68% 80% 80% 77% 56% 80% 79% 68% 83% 63% 84% 90% 88% 88% 87% 83% 76% 82% 90% 85% 82% 83% 93% 77% 78% 91% 83% 80% 72% 88% 83% 77% 85% 80% 80% 74% 77% 88% 81% 75% 88% 90% 85% 83% 90% 91% 84% 65% 67% 76% 71% 55% 54% 80% 68% 56% 72% 66% 83% 79% 81% 81% 78% 69% 69% 75% 85% 71% 78% 77% 87% 75% 78% 80% 75% 74% 75% 81% 75% 74% 77% 76% 90% 85% 86% 80% 78% 76% 84% 87% 75% 79% 80% 81% MTSU 81% 74% MTSU 86% 86% 62% 71% 89% 70% 82% 83% 81% 70% 73% 64% 63% 79% 74% 79% 91% 84% 87% 91% 88% 64% MTSU 91% 72% 77% 85% 78% 72% 70% 85% 77% 75% 80% 77% 84% 81% 82% 83% 79% 76% 77% 85% 83% 79% 85% 86% Middle Tennessee State University Graduating Senior Survey AY 2014 - 2015 (Fall 2014 and Spring 2015) Colleges and University BAS BHS BUS Satisfaction with Student Services Percent selecting 'Satisfied' or 'Very Satisfied' Q38. Admissions publications (e.g., catalogs, class schedules) Q39. Registration process Q40. Business office/cashier Q41. Multicultural Affairs services Q42. Student activities (e.g. films, speakers, performing arts, concerts) Q43. Residence halls Q44. Campus Recreation Center Q45. Opportunities to join campus clubs and organizations Q46. Financial Aid services Q47. Career Development Center Q48. Food services on campus Q49. Student Health services Q50. Library services Q51. Computer Lab/Center services Q52. Bookstore services and products Q53. Campus parking Q54. Campus security Q55. Counseling and Testing Services Q56. Disabled Student Services Q57. International Programs and Services Q58. June Anderson Center for Women and Non-Traditional Students Employment Data and Plans Following Graduation Q11. Average number of hours employed (on/off campus) per week during past year None 1 to 10 11 to 20 21 to 34 35 or more Q12. What was your primary reason for working? Basic Survival needs (food, everyday clothing, shelter) Academic Expenses (tuition, books and fees) Personal needs and desires (new clothing, new car) Lifestyle enhancement (entertainment, travel) Q13. What are your immediate employment plans? I don't know yet I have accepted a job I am continuing in my current position I will be going to graduate or professional school full-time next year I will be going to graduate or professional school part-time and working part-time next year I am still seeking employment I am entering military service Q14. To what extent is your new job related to your area of study at MTSU? Directly related Somewhat related Not related Not applicable (Currently do not have nor will be starting new job) Q15. What is the highest educational degree you plan to earn? Master's degree Specialist degree (e.g. Ed.S.) Professional degree (e.g. medicine, law, theology) Doctoral degree (e.g. Ph. D., Ed.D.) Not applicable (Not continuing my education) 88% 83% 87% 88% 90% 75% 97% 89% 82% 86% 76% 94% 96% 94% 80% 25% 67% 91% 95% 90% 89% 93% 86% 91% 93% 92% 76% 97% 90% 80% 94% 78% 96% 96% 93% 83% 31% 69% 93% 91% 92% 92% 92% 87% 90% 92% 92% 73% 97% 89% 83% 87% 76% 95% 93% 93% 80% 29% 63% 92% 95% 89% 91% BAS BHS BUS ED LA MC UC 88% 84% 93% 94% 96% 88% 99% 93% 82% 93% 86% 96% 93% 95% 93% 38% 70% 88% 88% 87% 86% 90% 82% 81% 88% 91% 69% 97% 86% 75% 80% 67% 91% 95% 91% 73% 23% 65% 90% 88% 91% 85% 84% 92% 71% 85% 83% 89% 87% 93% 89% 93% 66% 82% 99% 100% 91% 91% 72% 84% 75% 90% 64% 85% 92% 95% 94% 95% 93% 98% 73% 89% 21% 36% 62% 77% 86% 91% 96% 92% 84% 95% 98% 94% ED LA MC UC MTSU 90% 83% 87% 91% 91% 73% 98% 89% 79% 87% 75% 94% 95% 93% 80% 27% 67% 91% 92% 90% 91% MTSU 16% 10% 24% 32% 19% 14% 7% 22% 35% 22% 14% 7% 21% 30% 29% 23% 10% 30% 23% 14% 17% 9% 22% 31% 21% 11% 8% 30% 31% 20% 14% 4% 12% 17% 53% 15% 8% 23% 31% 25% 64% 24% 21% 15% 71% 20% 20% 13% 69% 20% 19% 16% 73% 23% 24% 16% 70% 23% 20% 15% 69% 17% 20% 17% 85% 22% 24% 22% 70% 21% 21% 16% 11% 11% 16% 18% 6% 36% 3% 14% 7% 14% 16% 10% 37% 2% 14% 13% 18% 10% 6% 39% 1% 13% 8% 4% 8% 2% 66% 0% 20% 8% 15% 15% 7% 34% 1% 18% 12% 19% 3% 3% 45% 0% 17% 7% 36% 7% 8% 24% 2% 15% 9% 17% 13% 7% 38% 1% 36% 14% 13% 38% 30% 12% 19% 38% 32% 22% 9% 36% 40% 11% 8% 41% 17% 17% 19% 47% 26% 14% 15% 44% 15% 31% 27% 27% 28% 17% 16% 39% 37% 51% 2% 2% 12% 6% 16% 20% 33% 21% 57% 1% 1% 8% 34% 60% 6% 0% 9% 26% 45% 1% 10% 18% 26% 38% 1% 4% 3% 55% 62% 3% 4% 4% 27% 48% 2% 6% 13% 31% Office of Institutional Effectiveness, Planning, and Research Middle Tennessee State University Graduating Senior Survey AY 2014 - 2015 (Fall 2014 and Spring 2015) Colleges and University BAS BHS BUS Background Information Q1. Gender Female Male Q2. Citizenship U.S. Other Q3. Ethnicity/Race Hispanic/Latino White Black or African American Asian American Indian Native Hawaiian or Other Pacific Islander Q4. Current Age 24 or under 25 to 30 31 to 35 36 or over Q5. While pursing this degree, did you: Originally enroll (and remain) at MTSU Transfer from a 2-year institution Transfer from a 4-year institution Other Q6. Number of years in attendance at MTSU 1 2 3 4 5 6 or more Q7. Please estimate your cumulative GPA upon completion of your degree 2.00-2.49 2.50-2.99 3.00-3.49 3.50-4.00 Q8. Number of semesters you have lived in an MTSU residence hall 1 2 3 4 or more None Q9. Have you participated in any of these extracurricular activities? Fraternity/Sorority Athletics SGA Intramurals Other service organizations or clubs Political activities Q10. Are you a first-generation graduate (i.e., neither parent has a bachelor's degree? (answer = 'Yes') LA MC UC MTSU 93% 7% 60% 40% 43% 57% 60% 40% 54% 46% 38% 72% 62% 28% 38% 62% 97% 98% 3% 2% 97% 100% 3% 0% 99% 100% 1% 0% 99% 1% 98% 2% 3% 3% 79% 72% 12% 22% 4% 2% 1% 1% 1% 0% 3% 75% 15% 6% 0% 0% 2% 87% 12% 0% 0% 0% 5% 81% 12% 2% 0% 0% 4% 77% 17% 1% 1% 1% 2% 65% 30% 2% 0% 0% 4% 76% 17% 3% 0% 0% 77% 76% 14% 14% 6% 5% 3% 5% 70% 20% 6% 5% 77% 8% 7% 9% 78% 16% 3% 3% 87% 11% 1% 1% 48% 25% 9% 18% 74% 16% 5% 5% 62% 59% 15% 22% 20% 16% 3% 4% 56% 23% 17% 4% 56% 26% 14% 4% 62% 18% 18% 2% 59% 19% 20% 2% 43% 27% 22% 8% 58% 20% 18% 3% 1% 9% 20% 40% 24% 5% 0% 12% 19% 38% 24% 7% 1% 16% 17% 36% 21% 10% 0% 21% 18% 35% 22% 4% 1% 11% 18% 38% 26% 7% 0% 11% 24% 45% 16% 4% 2% 17% 15% 24% 21% 21% 1% 13% 19% 38% 22% 8% 4% 4% 24% 20% 47% 45% 25% 31% 5% 37% 38% 20% 2% 11% 41% 46% 6% 26% 39% 30% 1% 25% 45% 28% 19% 41% 29% 10% 6% 26% 42% 26% 5% 6% 15% 16% 1% 2% 10% 9% 68% 68% 6% 14% 1% 8% 72% 6% 14% 0% 6% 74% 7% 17% 2% 10% 65% 9% 22% 3% 15% 51% 9% 10% 4% 9% 68% 6% 16% 2% 10% 66% 13% 16% 6% 7% 2% 3% 22% 20% 83% 83% 2% 3% 17% 10% 3% 26% 78% 2% 19% 4% 3% 18% 78% 4% 16% 7% 4% 16% 84% 12% 18% 5% 3% 21% 90% 2% 8% 12% 0% 14% 76% 2% 15% 7% 3% 20% 82% 4% 46% 53% 48% 51% 44% 36% 55% 48% ED LA MC UC 81% 72% 84% 63% 68% 85% 76% 88% 69% 71% 58% 63% 82% 62% 56% 82% 78% 87% 71% 75% BAS BHS BUS Walker Library Percent selecting 'Somewhat' or 'Very Much' L1. My major courses required me to use the Walker library's facilities, services, & collections. L2. I received knowledgeable, helpful assistance in the library. L3. In using the Walker Library I could usually find what I was looking for. L4. I received the training I needed to use the library and its resources. L5. Walker library has played an important role in my success at MTSU ED 71% 72% 89% 64% 64% Office of Institutional Effectiveness, Planning, and Research 86% 80% 92% 73% 75% 71% 67% 85% 62% 64% MTSU 77% 73% 88% 67% 68%

