Math 4600, Final Exam (take-home)
advertisement
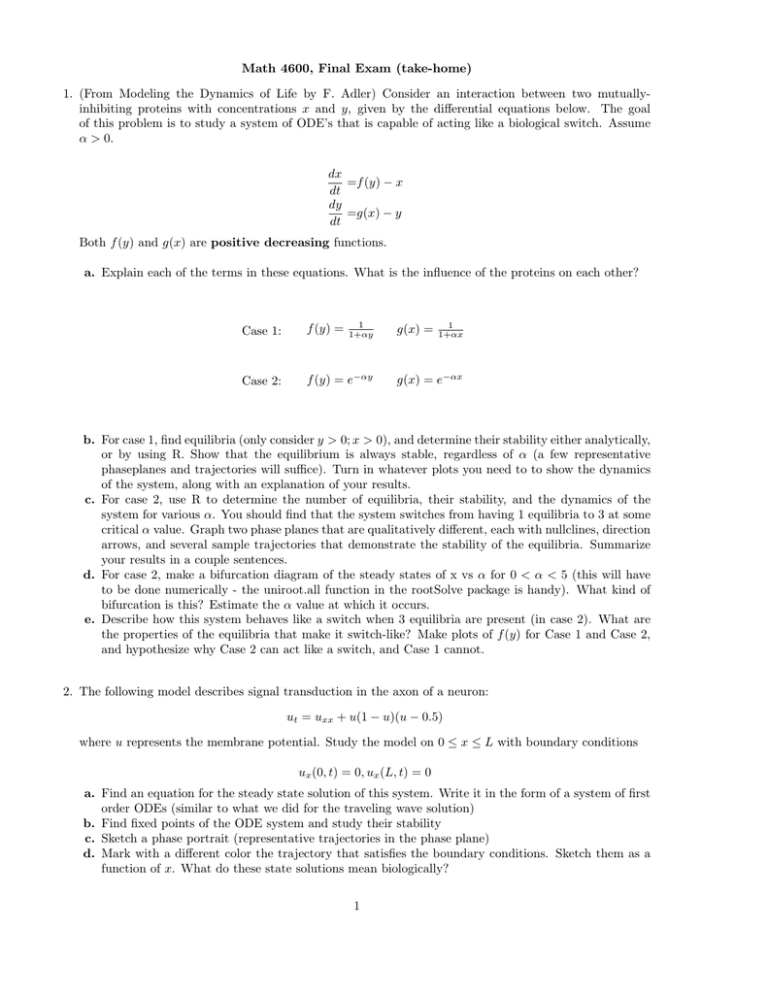
Math 4600, Final Exam (take-home) 1. (From Modeling the Dynamics of Life by F. Adler) Consider an interaction between two mutuallyinhibiting proteins with concentrations x and y, given by the differential equations below. The goal of this problem is to study a system of ODE’s that is capable of acting like a biological switch. Assume α > 0. dx =f (y) − x dt dy =g(x) − y dt Both f (y) and g(x) are positive decreasing functions. a. Explain each of the terms in these equations. What is the influence of the proteins on each other? 1 1+αy Case 1: f (y) = Case 2: f (y) = e−αy g(x) = 1 1+αx g(x) = e−αx b. For case 1, find equilibria (only consider y > 0; x > 0), and determine their stability either analytically, or by using R. Show that the equilibrium is always stable, regardless of α (a few representative phaseplanes and trajectories will suffice). Turn in whatever plots you need to to show the dynamics of the system, along with an explanation of your results. c. For case 2, use R to determine the number of equilibria, their stability, and the dynamics of the system for various α. You should find that the system switches from having 1 equilibria to 3 at some critical α value. Graph two phase planes that are qualitatively different, each with nullclines, direction arrows, and several sample trajectories that demonstrate the stability of the equilibria. Summarize your results in a couple sentences. d. For case 2, make a bifurcation diagram of the steady states of x vs α for 0 < α < 5 (this will have to be done numerically - the uniroot.all function in the rootSolve package is handy). What kind of bifurcation is this? Estimate the α value at which it occurs. e. Describe how this system behaves like a switch when 3 equilibria are present (in case 2). What are the properties of the equilibria that make it switch-like? Make plots of f (y) for Case 1 and Case 2, and hypothesize why Case 2 can act like a switch, and Case 1 cannot. 2. The following model describes signal transduction in the axon of a neuron: ut = uxx + u(1 − u)(u − 0.5) where u represents the membrane potential. Study the model on 0 ≤ x ≤ L with boundary conditions ux (0, t) = 0, ux (L, t) = 0 a. Find an equation for the steady state solution of this system. Write it in the form of a system of first order ODEs (similar to what we did for the traveling wave solution) b. Find fixed points of the ODE system and study their stability c. Sketch a phase portrait (representative trajectories in the phase plane) d. Mark with a different color the trajectory that satisfies the boundary conditions. Sketch them as a function of x. What do these state solutions mean biologically? 1 3. The growth of tumors is sometimes modeled by a Gompertz model N dN = −bN ln( ) dt K (1) with parameters b and K. Suppose that between treatments, tumor growth satisfies equation (1). When treatment is applied, the tumor size is reduced by a fraction 0 < δ < 1 (if N was pretreatment size, δN is post treatment size). Immediately after treatment, the tumor size is measured. Suppose treatment is given every τ time units. N a. Solve equation (1) by using the change of variables u = ln( K ). Write the solution in terms of N(t), assuming that Nn (0) is the initial size of the tumor on the nth measurement. b. Write down the difference equation that describes the size of the tumor on the nth measurement (measured after τ growth-time and application of treatment). This is similar to the dosage model described in class. c. Find fixed points, and determine their stability analytically. d. What interval of dosage time will keep the discrete time measurement of the tumor at size N̂ ? 4. Modify the model for disease spread in a family to describe the spread of a disease within and between two identical families of five each. Assume that the contact rate between families is different from the contact rate within them. Show, in detail, a derivation and provide a description of how this could be simulated (you don’t have to simulate it). 2
