Detecting population recovery using gametic disequilibrium-based effective population size estimates
advertisement

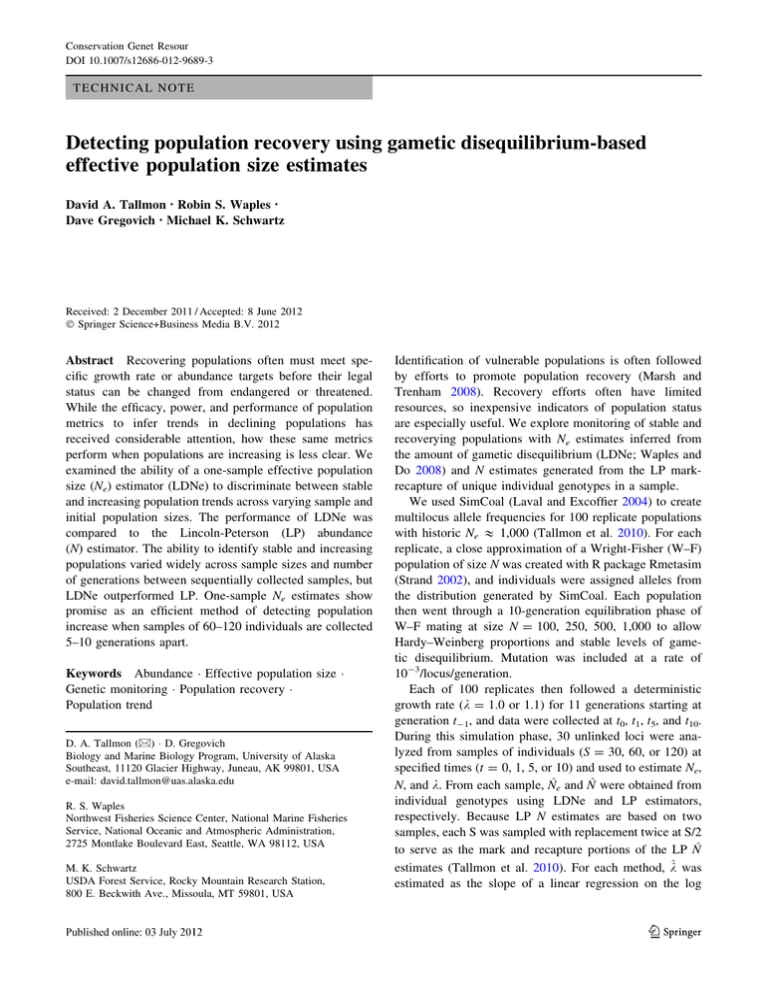
Conservation Genet Resour DOI 10.1007/s12686-012-9689-3 TECHNICAL NOTE Detecting population recovery using gametic disequilibrium-based effective population size estimates David A. Tallmon • Robin S. Waples • Dave Gregovich • Michael K. Schwartz Received: 2 December 2011 / Accepted: 8 June 2012 Ó Springer Science+Business Media B.V. 2012 Abstract Recovering populations often must meet specific growth rate or abundance targets before their legal status can be changed from endangered or threatened. While the efficacy, power, and performance of population metrics to infer trends in declining populations has received considerable attention, how these same metrics perform when populations are increasing is less clear. We examined the ability of a one-sample effective population size (Ne) estimator (LDNe) to discriminate between stable and increasing population trends across varying sample and initial population sizes. The performance of LDNe was compared to the Lincoln-Peterson (LP) abundance (N) estimator. The ability to identify stable and increasing populations varied widely across sample sizes and number of generations between sequentially collected samples, but LDNe outperformed LP. One-sample Ne estimates show promise as an efficient method of detecting population increase when samples of 60–120 individuals are collected 5–10 generations apart. Keywords Abundance Effective population size Genetic monitoring Population recovery Population trend D. A. Tallmon (&) D. Gregovich Biology and Marine Biology Program, University of Alaska Southeast, 11120 Glacier Highway, Juneau, AK 99801, USA e-mail: david.tallmon@uas.alaska.edu R. S. Waples Northwest Fisheries Science Center, National Marine Fisheries Service, National Oceanic and Atmospheric Administration, 2725 Montlake Boulevard East, Seattle, WA 98112, USA M. K. Schwartz USDA Forest Service, Rocky Mountain Research Station, 800 E. Beckwith Ave., Missoula, MT 59801, USA Identification of vulnerable populations is often followed by efforts to promote population recovery (Marsh and Trenham 2008). Recovery efforts often have limited resources, so inexpensive indicators of population status are especially useful. We explore monitoring of stable and recoverying populations with Ne estimates inferred from the amount of gametic disequilibrium (LDNe; Waples and Do 2008) and N estimates generated from the LP markrecapture of unique individual genotypes in a sample. We used SimCoal (Laval and Excoffier 2004) to create multilocus allele frequencies for 100 replicate populations with historic Ne & 1,000 (Tallmon et al. 2010). For each replicate, a close approximation of a Wright-Fisher (W–F) population of size N was created with R package Rmetasim (Strand 2002), and individuals were assigned alleles from the distribution generated by SimCoal. Each population then went through a 10-generation equilibration phase of W–F mating at size N = 100, 250, 500, 1,000 to allow Hardy–Weinberg proportions and stable levels of gametic disequilibrium. Mutation was included at a rate of 10-3/locus/generation. Each of 100 replicates then followed a deterministic growth rate (k = 1.0 or 1.1) for 11 generations starting at generation t-1, and data were collected at t0, t1, t5, and t10. During this simulation phase, 30 unlinked loci were analyzed from samples of individuals (S = 30, 60, or 120) at specified times (t = 0, 1, 5, or 10) and used to estimate Ne, N, and k. From each sample, N^e and N^ were obtained from individual genotypes using LDNe and LP estimators, respectively. Because LP N estimates are based on two samples, each S was sampled with replacement twice at S/2 to serve as the mark and recapture portions of the LP N^ estimates (Tallmon et al. 2010). For each method, ^ k was estimated as the slope of a linear regression on the log 123 Conservation Genet Resour transforms of the point estimates of abundance at t0 and ti. In some replicates, ^ k was not estimated because an N^e was infinite or N^ ¼ 0. We assessed performance of the LDNe and LP methods by recording the proportion of times N^e or N^ estimates taken from sequentially collected samples produced 0.95 \ ^ k \ 1.05 when true k = 1.0 (stable), and ^ k [ 1.05 when true k = 1.1 (increasing). The power to identify an increasing population was always lower than the power to detect a stable one for a given set of sampling constraints. Variability in ^ k obtained from ^ both methods—based on either Ne (LDNe method) or N^ (LP method)—ranged from high for small sample, 1-generation trials, to much lower for larger samples and generation times (Fig. 1). In general, power was low (\0.60) if sample size was small (S = 30; Table 1). At larger samples sizes (S = 60–120) and 5–10 generations between samples ^ ^ N^e - and N-based k began to distinguish k = 1.0 from k = 1.1 consistently (Fig. 1). At 10 generations between samples, the difference in peaks of ^ k frequency distributions became much more pronounced (Fig. 1). LDNe method sample size = 60 sample size = 30 50 d s i n/a 40 43 6 44 7 46 2 47 5 30 gen0− gen1 sample size = 120 d s i n/a 37 5 58 0 44 9 47 0 d s i n/a 41 16 43 0 31 13 56 0 d s i n/a 27 44 29 0 10 20 69 1 d s i n/a 13 74 13 0 1 19 80 0 d s i n/a 7 83 10 0 1 19 74 6 d s i n/a 2 96 2 0 0 9 91 0 20 10 gen0− gen5 frequency Fig. 1 Distributions of LDNeand LP-based ^k estimates of population growth rate (k = 1.0 or 1.1) with initial N = 250. The values in the upper left of each panel are the number of 100 replicates indicating declining (d; ^k\ 0.95), stable (s; 0.95 \ ^k \ 1.05), increasing (i; ^ k [ 1.05), or inestimable (n/a) ^k for stable (top row) and recovering (bottom row) populations Because the strength of genetic drift is larger at smaller population sizes, N^e -based estimates of k were much better at N = 250 or 100 than at 500 or 1,000, and improved as more generations passed between sampling events (see ^ At N = 500 or Table 1). N^e usually outperformed N. ^ ^ 1,000, the power of Ne and N to correctly identify the population growth rate was fairly low unless sample sizes were large (S = 120) and 5–10 generations passed between sampling events. At large sample sizes (S = 120), statistical power to detect population trends with N^e from samples taken 5–10 generations apart was much higher ([.70), except at the largest N = 1,000 (Table 1). In general, as other authors have noted, it is easier to detect declining populations than increasing ones (Tallmon et al. 2010). In our simulations, the LDNe estimator detects increasing abundance over intervals of C5 generations between samples. Species with large numbers of individuals available for sampling (such as offspring) and short generation times, may lend themselves to monitoring with LDNe. Organisms with long generation times and a small 0 50 d s i n/a 40 35 24 29 12 23 17 47 13 30 20 10 0 50 d s i n/a 40 32 37 23 8 25 43 20 12 30 gen0− gen10 20 10 0 0.6 0.8 1.0 1.2 1.4 0.6 0.8 1.0 1.2 1.4 0.6 0.8 1.0 1.2 1.4 1.0 1.2 1.4 L−P method 50 d s i n/a 40 10 16 10 64 30 4 12 9 75 gen0− gen1 d s i n/a 48 15 35 2 38 14 39 9 d s i n/a 51 6 43 0 26 13 61 0 d s i n/a 7 20 8 65 5 13 10 72 d s i n/a 29 39 32 0 11 21 54 14 d s i n/a 17 58 25 0 0 31 69 0 d s i n/a 1 35 3 61 1 18 2 79 d s i n/a 13 72 14 1 1 36 33 30 d s i n/a 6 92 2 0 0 11 89 0 20 gen0− gen5 frequency 10 0 50 40 30 20 10 0 50 40 gen0− gen10 30 20 10 0 0.6 0.8 1.0 λ= 1 λ = 1.1 123 1.2 1.4 0.6 0.8 1.0 ^ λ 1.2 1.4 0.6 0.8 Conservation Genet Resour ^ Table 1 Percentage of times population trend was correctly identified in stable or increasing populations using the LDNe (N^e ) or LP (N) methods over a range of initial abundances (N), generations (gens), and sample sizes (S) Stable population Gens 0–1 N = 100 N = 250 N = 500 N = 1000 Increasing population Gens 0–5 Gens 0–10 Gens 0–1 Gens 0–5 Gens 0–10 ^ Ne N^ ^ Ne N^ ^ Ne N^ ^ Ne N^ ^ Ne N^ ^ Ne N^ S = 30 50 55 66 50 83 67 59 33 74 33 73 15 S = 60 55 61 82 83 98 96 44 48 77 68 90 70 S = 30 S = 60 49 42 26 63 59 71 27 68 69 90 36 86 47 47 9 39 47 69 10 54 43 74 2 33 S = 120 57 57 87 75 98 98 56 61 80 69 91 89 S = 30 43 10 44 9 50 14 37 1 33 1 33 0 S = 60 51 50 65 56 75 55 53 25 54 20 49 7 S = 120 58 58 81 83 92 93 47 49 73 62 74 66 S = 30 24 2 27 0 40 4 28 1 20 0 18 0 S = 60 33 27 41 26 54 34 38 7 35 6 36 0 S = 120 59 68 64 71 80 77 57 42 54 44 61 38 Values C70 are in bold text to ease identification number of individuals available for sampling may not fall within the range of utility of the LDNe method. Ne estimates may be more useful in real-world populations than the W–F populations simulated here. In W–F populations N and Ne are the same. In cases where high variance in mating success or offspring survival produce small Ne/N ratios, tracking population trends with N^e can take advantage of the relatively large effects of genetic drift and make N^e a useful index of population trend. For example, if true N = 1,000, a small Ne/N ratio may make Ne = 100 and the population will be subject to large genetic drift and behave genetically like a small population. However, a potential downside to using N^e as an index of N is that there may be temporal fluctuations in Ne/N due to changes in the relative reproductive success of individuals. Further investigation of the feasibility of tracking N with N^e in recovering populations is warranted, as researchers often can obtain both N with N^e estimates from a single dataset if studies are designed carefully. Conservation and Management’ (PIs Fred Allendorf and Mike Schwartz) supported by the National Evolutionary Synthesis Center (NSF #EF-0423641) and the National Center for Ecological Analysis and Synthesis, a Center funded by the U.S. National Science Foundation (NSF #DEB-0553768), the University of California, Santa Barbara and the State of California. References Laval G, Excoffier L (2004) SIMCOAL 2.0: a program to simulate genomic diversity over large recombining regions in a subdivided population with a complex history. Bioinformatics 20: 2485–2487 Marsh DM, Trenham PC (2008) Current trends in plant and animal population monitoring. Conserv Biol 22:647–655 Strand AE (2002) Metasim 1.0: an individual-based environment for simulating population genetics of complex population dynamics. Mol Ecol Notes 2:373–376 Tallmon DA, Gregovich D, Waples R et al (2010) When are genetic methods useful for estimating contemporary abundance and detecting population trends? Mol Ecol Resour 10:684–692 Waples RS, Do C (2008) LDNE: a program for estimating effective population size from data on linkage disequilibrium. Mol Ecol Resour 8:753–756 Acknowledgments This work was conducted as part of the ‘Working Group on Genetic Monitoring: Development of Tools for 123


