Chapter 8 odd (exclude 8-19 to 8-27) difference scores d.
advertisement
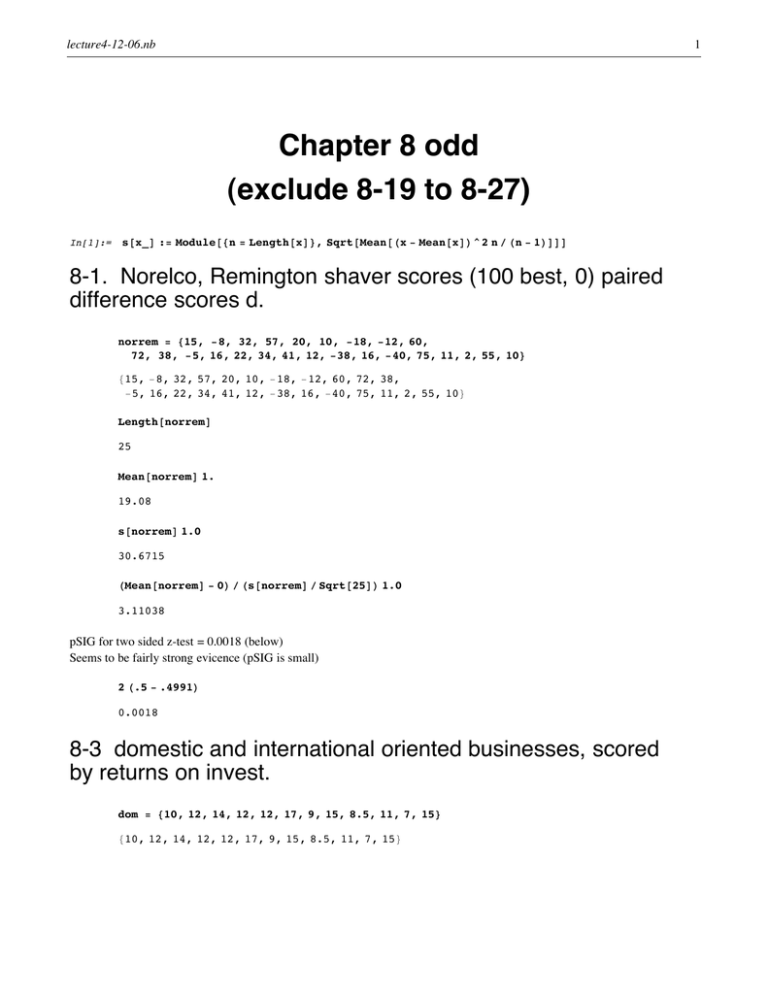
lecture4-12-06.nb 1 Chapter 8 odd (exclude 8-19 to 8-27) In[1]:= s@x_D := Module@8n = Length@xD<, Sqrt@Mean@Hx - Mean@xDL^ 2 n ê Hn - 1LDDD 8-1. Norelco, Remington shaver scores (100 best, 0) paired difference scores d. norrem = 815, -8, 32, 57, 20, 10, -18, -12, 60, 72, 38, -5, 16, 22, 34, 41, 12, -38, 16, -40, 75, 11, 2, 55, 10< 815, -8, 32, 57, 20, 10, -18, -12, 60, 72, 38, -5, 16, 22, 34, 41, 12, -38, 16, -40, 75, 11, 2, 55, 10< Length@norremD 25 Mean@norremD 1. 19.08 s@norremD 1.0 30.6715 HMean@norremD - 0L ê Hs@norremD ê Sqrt@25DL 1.0 3.11038 pSIG for two sided z-test = 0.0018 (below) Seems to be fairly strong evicence (pSIG is small) 2 H.5 - .4991L 0.0018 8-3 domestic and international oriented businesses, scored by returns on invest. dom = 810, 12, 14, 12, 12, 17, 9, 15, 8.5, 11, 7, 15< 810, 12, 14, 12, 12, 17, 9, 15, 8.5, 11, 7, 15< lecture4-12-06.nb 2 int = 811, 14, 15, 11, 12.5, 16, 10, 13, 10.5, 17, 9, 19< 811, 14, 15, 11, 12.5, 16, 10, 13, 10.5, 17, 9, 19< diff = dom - int 8-1, -2, -1, 1, -0.5, 1, -1, 2, -2., -6, -2, -4< Length@diffD 12 Mean@diffD -1.29167 HMean@diffD - 0L ê Hs@diffD ê Sqrt@12DL -2.03405 I interpret as two-sided. So pSIG = 0.0424 when calculated from z-table. When calculated from t-table pSIG is between 5% and 10%, even less than for z. This is not particularly strong evidence against the hypothesis of no difference. 2 H.5 - 0.4788L 0.0424 8-5 Sales before vs after new shelf facings. Difference scores normal. before = 857, 61, 12, 38, 12, 69, 5, 39, 88, 9, 92, 26, 14, 70, 22< 857, 61, 12, 38, 12, 69, 5, 39, 88, 9, 92, 26, 14, 70, 22< after = 860, 54, 20, 35, 21, 70, 1, 65, 79, 10, 90, 32, 19, 77, 29< 860, 54, 20, 35, 21, 70, 1, 65, 79, 10, 90, 32, 19, 77, 29< Length@beforeD 15 1.0 HMean@afterD - Mean@beforeDL 3.2 HMean@after - beforeD - 0L ê Hs@before - afterD ê Sqrt@15DL 1.0 1.46907 One sided test for alpha = 0.05. t(alpha) = t(0.05) = 1.761. The test statistic of 1.46907 fails to exceed 1.761. FAIL TO REJECT H0 8-7 lecture4-12-06.nb 8-7 8-9 Without LINC, time to code is x1BAR = 26 min s1 = 8 minutes n1 = 45 programmers timed With LINC x2BAR = 21 min s2 = 6 min n2 = 32 programmers timed H0: LINC does not shorten mean time. I have oriented noLINC - LINC. H26. - 21L ê Sqrt@8 ^ 2 ê 45 + 6 ^ 2 ê 32D 3.13283 pSIG for one sided z-test is pSIG = 0.0009 which is small (see below). Strong evidence to reject H0. H.5 - .4991L 0.0009 8-11 Bel Air vs Marin County, which has pricier homes? For Bel Air: avg 345650 s = 48500 n = 32 For Marin County: avg 289440 s = 87090 n = 35 Two sided H0: diff of means is zero. H345650. - 289440L ê Sqrt@48500 ^ 2 ê 32 + 87090 ^ 2 ê 35D 3.29956 pSIG for two sided is pSIG = 0.001 which is small (see below). The evidence is strong to rejct. 3 lecture4-12-06.nb 2 H.5 - .4995L 0.001 8-13. Commercials: for teens, does rock music sell better than words? For rock music oriented ADs avg = 23.5 s = 12.2 n = 128 For verbal ADs avg = 18 s = 10.5 n = 212 Two sided H0: diff of means is zero. Population of teens is so large the samples are effectively independent. H23.5 - 18L ê Sqrt@12.2 ^ 2 ê 128 + 10.5 ^ 2 ê 212D 4.23974 pSIG < 0.00006 for two sided z-test (see below). This is exceedingly stron evidence with which to reject H0. 2 H.5 - .49997L 0.00006 8-15 Do models of Liz Claiborne clothing earn more than models of Calvin Klein? H0: Liz Claiborne no better than Calvin Klein. One-sided z-test for alpha = 0.05. For Lis Claiborne: avg $4238 s = 1002.5 n=32 For Calvin Klein: avg 3888.72 s=876.05 n=37 H4238 - 3888.72L ê Sqrt@1002.5 ^ 2 ê 32 + 876.05 ^ 2 ê 37D 1.52951 4 lecture4-12-06.nb one sided alpha = 0.05 and z(0.05) = 1.645 fail to reject since test statistic 1.52951 does not exceed 1.645. Confirm: pSIG = P(Z > 1.53) = (.5 - 0.437)= 0.563 not < .05 Re-do for sample sizes of n1 = 10 and n2 = 11. pSIG is much worse (larger). H4238 - 3888.72L ê Sqrt@1002.5 ^ 2 ê 10 + 876.05 ^ 2 ê 11D 0.846456 I don't use the t here! 8-17 Earnings (percent of investment) for "researched" investments vs "non-researched." told dBAR = 2.54% in favor of researched. d = res - nonres. Non-researched: s=0.64% n=255 Researched: s=.85% n=300 Want 95% CI for md . 2.54 + 1.96 8-1, 1< Sqrt@.64 ^ 2 ê 255 + .85 ^ 2 ê 300D 82.41581, 2.66419< 8-29 Northwest on-time 85/ 100 before merger with Republic 68/ 100 after merger indep samples of 100 H0 = no CHANGE since merger H1 = decline since merger before-after H.85 - .68L - 0 0.17 Pooled estimate, sensible if no difference after merger H85. + 68L ê 200 0.765 5 lecture4-12-06.nb 6 Pooled estimate of sd of p1HAT-p2HAT valid if merger made no change Sqrt@.765 .235 H1 ê 100 + 1 ê 100LD 0.0599625 H.85 - .68 - 0L ê Sqrt@.765 .235 H1 ê 100 + 1 ê 100LD 2.83511 pSIG for one sided z-test is 0.0023(see below). It is rahter small so rather convincing evidence against H0 that merger has changed nothing. H.5 - .4977L 0.0023 Same problem, BUT ignoring the use of the pooled estimate. It does not differ by much from the pooled approach. H.85 - .68L 0.17 H.85 - .68 - 0L ê Sqrt@.85 .15 ê 100 + .68 .32 ê 100D 2.89385 H.5 - .4981L 0.0019 Textbook has instead used the pooled estimate 2.835 leading to pSIG .0023. 8-31 Two corporate raiders. Who succeeds most? Raider A: 11 of 31 success rate in takeovers Raider B: 19 of 50 success rate in takeovers. BUT ARE THESE IDENDEPEDENT, AND ARE THEY EVEN SAMPLES? Maybe takeovers are getting harder, expecially for A. Poor example. 811. ê 31, 19. ê 50< 80.354839, 0.38< lecture4-12-06.nb H11. ê 31 - 19. ê 50L -0.0251613 Pooled estimate ` ppooled = H11. + 19L ê H31 + 50L = 0.37037. It assumes there is no difference. H11. + 19L ê H31 + 50L 0.37037 H11. ê 31 - 19. ê 50L ê Sqrt@0.37 0.63 HH1 ê 31L + H1 ê 50LLD -0.227974 The test statistic is very near 0, so we obviously fail to reject the hypothesis of no difference. Now, the same hypothese tested without pooling. It gives almost the same. H11. ê 31 - 19. ê 50L -0.0251613 H11. ê 31 - 19. ê 50L ê Sqrt@H11 ê 31 20 ê 31L ê 31 + H19 ê 50 31 ê 50L ê 50D -0.228769 8-33 Refer 8-32 Before ad: 13% of 2060 prefer California wines. After ad: 19% of 5000 prefer California wines. Is there more than 5% added by the ad push? HH.19 - .13L - 0.05L ê Sqrt@H.13 .87L ê 2060 + H.19 .81L ê 5000D 1.08032 Not very significant at all. Here is a 95% CI. It overlaps 0.05. H.19 - .13L + 1.96 8-1, 1< Sqrt@H.13 .87L ê 2060 + H.19 .81L ê 5000D 80.0418572, 0.0781428< 7 lecture4-12-06.nb 8 8-35 34 of 120 US top execs prefer Airbus 41 of 200 EU " " " " H0: pUS ≤ pEU (not easily moved from this position) 34. ê 120 - 41 ê 200 0.0783333 8-37 48 of 200 men shown Esquire say they would subscribe. 61 of 200 men shown GQ say " Test equality of p1 p2 at alpha = .01. H48. ê 200 - 61. ê 200L -0.065 pooled est of p H48. + 61L ê H200 + 200L 0.2725 In[3]:= H48. ê 200 - 61. ê 200L ê Sqrt@0.2725 0.7275 H1 ê 200 + 1 ê 200LD Out[3]= -1.45987 pSIG = 2 P(Z > 1.46) 2-sided 2 H.5 - .4279L 0.1442 Since .1442 is not less than .01 fail to reject Same test but not pooled is almost the same! H48. ê 200 - 61. ê 200L -0.065 In[4]:= H48. ê 200 - 61. ê 200L ê Sqrt@H48. ê 200 152 ê 200L ê 200 + H61 ê 200 139 ê 200L ê 200D Out[4]= -1.46377 pSIG for this test is the same! 8-39 Tests of guidance systems. Motorola: 101 of 120 trials succeed. Blaupunkt: lecture4-12-06.nb 8-39 Tests of guidance systems. Motorola: 101 of 120 trials succeed. Blaupunkt: 110 of 200 trials succeed. Evidence to conclude Motorola superior? Try H0: Motorola not superior (bending over backwards to resist false claim). 101. ê 120 - 110 ê 200 0.291667 Pooled est H101. + 110L ê H120 + 200L 0.659375 In[5]:= H101. ê 120 - 110 ê 200L ê Sqrt@0.659375 0.340625 H1 ê 120 + 1 ê 200LD Out[5]= 5.32982 pSIG In[6]:= Exp@-5.32982^ 2 ê 2D ê H5.32982 Sqrt@2 PiDL Out[6]= 5.07808 µ 10-8 Unpooled analysis is not so close this time, but both are "highly significant." In[7]:= H101. ê 120 - 110 ê 200L ê Sqrt@H101 ê 120 19 ê 120L ê 120 + H110 ê 200 90 ê 200L ê 200D Out[7]= 6.01914 Exceeding rare by either method. 9

