URBAN MODIFICATIONS IN A MESOSCALE METEOROLOGICAL MODEL AND THE
advertisement
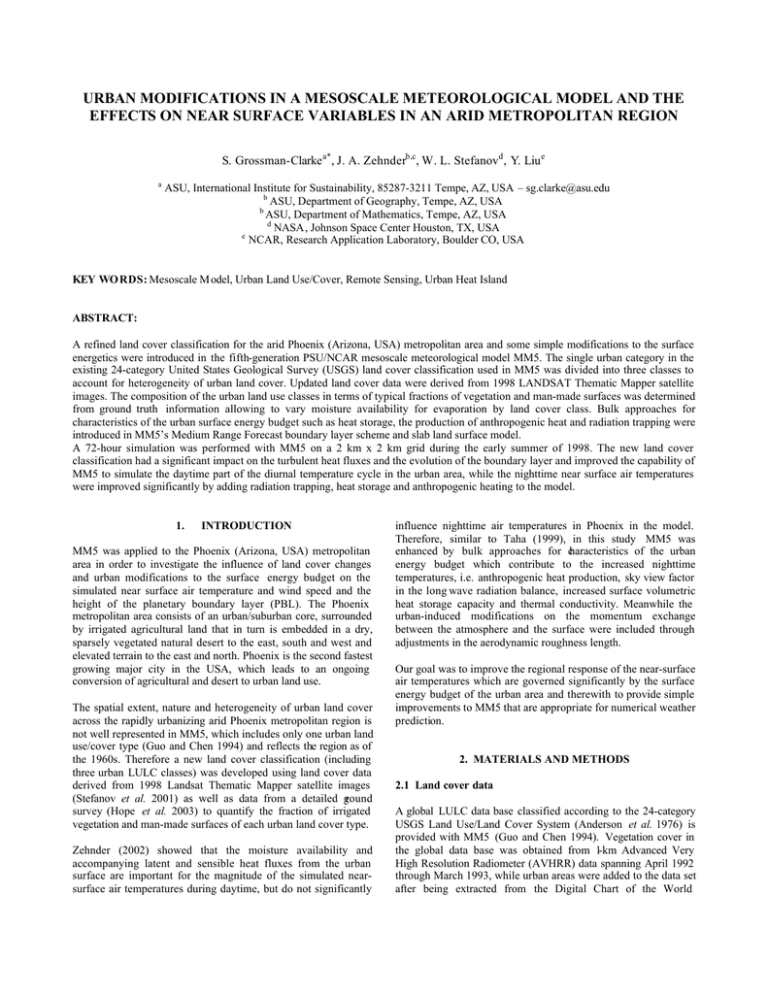
URBAN MODIFICATIONS IN A MESOSCALE METEOROLOGICAL MODEL AND THE EFFECTS ON NEAR SURFACE VARIABLES IN AN ARID METROPOLITAN REGION S. Grossman-Clarke a*, J. A. Zehnderb,c, W. L. Stefanovd , Y. Liu e a ASU, International Institute for Sustainability, 85287-3211 Tempe, AZ, USA – sg.clarke@asu.edu b ASU, Department of Geography, Tempe, AZ, USA b ASU, Department of Mathematics, Tempe, AZ, USA d NASA, Johnson Space Center Houston, TX, USA e NCAR, Research Application Laboratory, Boulder CO, USA KEY WO RDS: Mesoscale M odel, Urban Land Use/Cover, Remote Sensing, Urban Heat Island ABSTRACT: A refined land cover classification for the arid Phoenix (Arizona, USA) metropolitan area and some simple modifications to the surface energetics were introduced in the fifth-generation PSU/NCAR mesoscale meteorological model MM5. The single urban category in the existing 24-category United States Geological Survey (USGS) land cover classification used in MM5 was divided into three classes to account for heterogeneity of urban land cover. Updated land cover data were derived from 1998 LANDSAT Thematic Mapper satellite images. The composition of the urban land use classes in terms of typical fractions of vegetation and man-made surfaces was determined from ground truth information allowing to vary moisture availability for evaporation by land cover class. Bulk approaches for characteristics of the urban surface energy budget such as heat storage, the production of anthropogenic heat and radiation trapping were introduced in MM5’s Medium Range Forecast boundary layer scheme and slab land surface model. A 72-hour simulation was performed with MM5 on a 2 km x 2 km grid during the early summer of 1998. The new land cover classification had a significant impact on the turbulent heat fluxes and the evolution of the boundary layer and improved the capability of MM5 to simulate the daytime part of the diurnal temperature cycle in the urban area, while the nighttime near surface air temperatures were improved significantly by adding radiation trapping, heat storage and anthropogenic heating to the model. 1. INTRODUCTION MM5 was applied to the Phoenix (Arizona, USA) metropolitan area in order to investigate the influence of land cover changes and urban modifications to the surface energy budget on the simulated near surface air temperature and wind speed and the height of the planetary boundary layer (PBL). The Phoenix metropolitan area consists of an urban/suburban core, surrounded by irrigated agricultural land that in turn is embedded in a dry, sparsely vegetated natural desert to the east, south and west and elevated terrain to the east and north. Phoenix is the second fastest growing major city in the USA, which leads to an ongoing conversion of agricultural and desert to urban land use. The spatial extent, nature and heterogeneity of urban land cover across the rapidly urbanizing arid Phoenix metropolitan region is not well represented in MM5, which includes only one urban land use/cover type (Guo and Chen 1994) and reflects the region as of the 1960s. Therefore a new land cover classification (including three urban LULC classes) was developed using land cover data derived from 1998 Landsat Thematic Mapper satellite images (Stefanov et al. 2001) as well as data from a detailed ground survey (Hope et al. 2003) to quantify the fraction of irrigated vegetation and man-made surfaces of each urban land cover type. Zehnder (2002) showed that the moisture availability and accompanying latent and sensible heat fluxes from the urban surface are important for the magnitude of the simulated nearsurface air temperatures during daytime, but do not significantly influence nighttime air temperatures in Phoenix in the model. Therefore, similar to Taha (1999), in this study MM5 was enhanced by bulk approaches for characteristics of the urban energy budget which contribute to the increased nighttime temperatures, i.e. anthropogenic heat production, sky view factor in the long wave radiation balance, increased surface volumetric heat storage capacity and thermal conductivity. Meanwhile the urban-induced modifications on the momentum exchange between the atmosphere and the surface were included through adjustments in the aerodynamic roughness length. Our goal was to improve the regional response of the near-surface air temperatures which are governed significantly by the surface energy budget of the urban area and therewith to provide simple improvements to MM5 that are appropriate for numerical weather prediction. 2. MATERIALS AND METHODS 2.1 Land cover data A global LULC data base classified according to the 24-category USGS Land Use/Land Cover System (Anderson et al. 1976) is provided with MM5 (Guo and Chen 1994). Vegetation cover in the global data base was obtained from 1-km Advanced Very High Resolution Radiometer (AVHRR) data spanning April 1992 through March 1993, while urban areas were added to the data set after being extracted from the Digital Chart of the World (Defense Mapping Agency 1992) whose data were based on photogrammetric analyses of Department of Defense Corona imagery acquired in the 1960s. In this data set the extent of the Phoenix metropolitan area is under-represented, fallow farmland is mis-classified as active agriculture in some places and desert areas in Arizona are assigned as “shrubland”. A more recent 12-category land cover classification (Figure 1) with an overall accuracy of 85 % and a 30 m spatial resolution is available for the Phoenix metropolitan region derived from Landsat TM reflectance data (acquired for 24 May and 18 June 1998) using visible to short wave infrared spectral data (Stefanov et al. 2001). An expert system was constructed to perform postclassification sorting of the initial land cover classification using additional spatial datasets such as variance texture, a vegetation index, land use, water rights, city boundaries, and Native American reservation boundaries. Figure 1: 12-category land use/cover map for the Phoenix metropolitan area derived from 1998 Landsat Thematic Mapper reflectance data and ancillary datasets. The spatial resolution is 30 m/pixel. view factor for a road, Ψroad, of an infinitely long urban canyon, is calculated as a function of the road width, w (m), and the building height, h (m): 0 .5 2 (1) Ψroad = (h / w ) + 1 − h / w [ ] The sky view factor was introduced to the long wave radiation balance of the urban land cover categories in MM5’s slab model (Dudhia 1996). With a typical distance between two houses (including street and front yard) of 25 m and an average building height of 6 m (SURVEY-200 data, Hope et al. 2003), Ψ road was determined to be 0.78. A Ψsky of 0.85 for the xeric and mesic residential land use categories was obtained by averaging between Ψroad and a sky view factor of 1 for roofs which cover about 30 % of an urban model grid cell’s plan area. Anthropogenic Heat Flux Considering that anthropogenic heat is released directly into the air we included a source term in the governing equation of the temperature at the first prognostic level of the MRF scheme as suggested by Taha (1999). The main sources for the anthropogenic heat flux, Qa, in Phoenix are from traffic combustion and electricity consumption by air conditioners, which are typically located on roof tops. We adopted the approach of Sailor & Lu (2004) to calculate hourly profiles of Qa based on resident and working population density data obtained from the Maricopa Association of Governments. The hourly anthropogenic heat flux from traffic for each urban land use class is calculated furthermore as a function of the average daily vehicle distance traveled per person, hourly fractional traffic profiles and the energy release per vehicle per meter of travel, while the anthropogenic heat released through electricity consumption was calculated by means of monthly totals of electricity consumption aggregated at the state level Figure 2 shows the daily profiles of Qa for the three urban land use classes. 40 2.2 Parameterization of long wave radiation balance and anthropogenic heat flux Long Wave Radiation Balance The sky view factor, Ψsky, is a dimensionless parameter between 0 and 1 representing the fraction of visible sky at a reference site in comparison to the sky fraction over a flat horizontal surface without view obstruction. According to Masson (2000) the sky 35 30 -2 Qa (W m ) These land cover data were incorporated into MM5 using Geographical Information System techniques, mapping the 12 categories of Stefanov et al. (2001) 1998 to the subset of 24 categories in the USGS data set found within the study area. Each MM5 30 s grid cell was assigned the land cover class with the highest associated fraction of cover. In addition, two additional urban LULC classes were introduced into the revised LULC classification, to give three urban categories: urban built-up, urban mesic residential and urban xeric residential, which were distinguished by the type of vegetation and irrigation (no vegetation, well-watered flood or overhead irrigated, and droughtadapted vegetation with drip irrigation, respectively). The new urban categories were assigned indices 25 and 26 in the modified USGS data set. 25 20 15 10 5 0 0 2 4 6 8 10 12 14 16 18 20 22 Hour (LST) Figure 2: Simulated diurnal variation (LST) of anthropogenic heat production, Qa, for the Phoenix metropolitan area as included in MM5 for the urban land use classes. Plots represent (-x -) urban built-up; (-∆-) urban mesic residential; and (- -) urban xeric residential. 2.3 Physical Parameters of Urban Land Use Classes Physical parameters which characterize the land cover categories with respect to their influence on the surface energy budget in MM5 are the moisture availability factor, M (-), aerodynamic roughness length, z0 (m-1), albedo, εg, volumetric soil heat capacity, cg (J m-3 K-1), and heat conductivity, λT (W m-1 K-1). An overview of parameter values assigned to the three urban land use classes is given in Table 1 and information on how parameters were obtained can be found in Grossman-Clarke et al. (2005). Table 1: Physical parameters of the urban LULC classes as used in MM5. BuiltMesic Xeric up residential residential Fraction of 0.23 0.1 (partly 0 vegetation cover (/) (irrigated) irrigated) Moisture avail0.005 0.12 0.02 ability factor (/) Roughness length 0.8 0.5 0.5 for momentum [m] Heat capacity (106 J 3.0 2.4 2.7 m-3 K-1) Thermal conduc3.24 2.4 2.6 tivity (W m-1 K-1) Sky view factor (/) 0.85 0.85 0.85 additional urban LULC classes. Subsequently, the model physics (Qa, Ψsky, cg, λT) and urban parameters were only changed in the case of the 1998 26-category scenario. The influence of the different LULC scenarios on the simulated 2 m air temperatures, wind speeds and PBL heights was investigated. Figures 3(a-c) show the land cover distributions and contours of terrain for most of the inner domain (2 km x 2 km grid spacing) as generated by MM5’s preprocessor TERRAIN for the standard release 24-category USGS LULC data, the 1998 24-category LULC data and after introducing three urban land cover classes to the 1998 data set. The refined LULC classification scheme significantly changed the extent of the urban area compared to that used in the standard release MM5. Significant changes can be recognized in the inhomogeneity of the urban land cover with urban built-up and xeric residential areas dominating within the city. The characteristic features of the 30 m resolution 1998 LULC map (Figure 1) are recognizable in Figure 3c, i.e. the extended urban built-up area to the east and west as well as the relatively large mesic residential area to the north of Sky Harbor Airport (station 1 in Figure 3c). An average albedo value of 0.16 for urban land cover types was obtained from examination of Moderate Resolution Imaging Spectroradiometer (MODIS) data for the Phoenix metropolitan area. 2.4 Design of numerical experiments MM5 version 3.6 was employed for a 72-hour simulation starting at 0000 Universal Time (UTC) 8 June 1998, i.e. 1700 Local Standard Time (LST) 7 June 1998. This period was chosen since it coincides with the Landsat images on which the land cover classification was based. Typically there is little synoptic forcing in the desert southwest at this time of year, which is true for our case. Nested simulations with four domains and resolutions of 54 km (size east-west 3294 km; north-south 2700 km), 18 km (size east-west 1350 km; north-south 1080 km), 6 km (size east-west 594 km; north-south 414 km) and 2 km (size east-west 212 km; north-south 132 km), respectively and 32 vertical layers were performed with MM5. The lowest prognostic level was approximately 7 m above ground level. The innermost domain included the Phoenix metropolitan area, surrounding desert and agricultural land. Initial and boundary conditions were provided by the NCEP ETA grid 212 (40 km resolution) analysis and included assimilation of upper air observations. Planetary boundary layer processes were included via the modified version of the non-local closure MRF scheme by Liu et al. (2004) with the five layer soil model (Dudhia 1996). The temperature at a height of 2 m, T 2m , and the horizontal components of wind speed at 10 m were determined diagnostically from the simulated ground temperature, the air temperature T as well as the horizontal wind speed components at the lowest prognostic level by means of the Monin-Obukhov similarity theory under consideration of the atmospheric stability. Simulations were carried out with the three land cover configurations presented in Figure 3: MM5 USGS 24-category land/use cover; 1998 24-category LULC in order to investigate the model results due to changes in the extent of the urban area; and 1998 26-category LULC with the introduction of two Figure 3: Land use and terrain as produced by MM5’s preprocessor TERRAIN for the inner modeling domain (2 km x 2 km grid resolution) based on (a) MM5 24-category USGS land use/cover data; (b) LANDSAT Thematic Mapper 1998 image derived land use/cover data with one urban category; and (c) LANDSAT Thematic Mapper 1998 image derived land use/cover data and three urban land use/cover classes. Plot (c) shows the location of surface meteorological stations. 3. RESULTS AND DISCUSSION 3.1 Near-surface Air Temperatures, Wind S peeds and Surface Energy Fluxes MM5’s performance was evaluated by means of comparing simulated 2 m air temperatures, T2m, and 10 m wind speeds, V10m, with data from the National Weather Service (NWS) station at Sky Harbor Airport and fifteen stations from the Phoenix Realtime Instrumentation for Surface Meteorological Studies (PRISMS) network (Figure 3c). Here we present only the observed and simulated T2m at the Sky Harbor Airport station for which the LULC was classified as urban built-up in both, the MM5 USGS 24-category and the 1998 26-category classification. Figure 4a shows the model results for the three land use scenarios of Figure 3. (a) 2 m Air Temperature (o C) 33 31 29 27 25 23 21 19 17 15 17 23 5 11 17 23 5 11 17 23 5 11 Hour (LST) 35 (b) 2 m Air Temperature ( o C) 33 31 29 27 25 23 21 19 17 15 17 23 5 11 17 23 5 11 17 23 5 11 Hour (LST) Figure 4: Observed and simulated 2 m air temperatures (T2m) for 1700 LST 7 June 1998 to 1700 LST 10 June 1998 for the NWS station at Sky Harbor Airport. Plots represent (-x-) observed; (a) (---) and (---) MM5 USGS 24-category LULC scenario with water availability factors of M=0.1 and M=0.01, respectively for the “shrubland” category; (—) 1998 24-category; and (—) 1998 26category LULC scenario; and (b) (—) without and (-?-) Qa, Ψsky , increased cg and λT . The results for the 1998 24-category LULC scenario (updated extent of the urban area but no change in classification and model physics) differ from the MM5 USGS 24-category scenario only slightly. However the maximum daytime temperatures were still underestimated by about 3 K. A much improved agreement between the observed and simulated morning to afternoon temperatures was achieved by introducing three urban LULC classes (1998 26-category scenario), while the effect of the LULC changes on the simulated nighttime temperatures was less than 2 K and a cold bias of 3-6 K was simulated when physical characteristics of the urban energy balance (Qa, Ψsky) were not included and default values of cg and λT were used. Figure 4b shows an improved model performance during the second and the third night of the simulation period when Qa, Ψsky and increased values for cg and λ T were included in the 1998 26catgeory simulations. Here a good agreement between the measured and simulated T2m throughout the diurnal cycle was achieved. However, the simulated 2 m air temperatures were overestimated during the first night, i.e. 12 hours after the start of the model run which was also the case for other simulation episodes for which we applied MM5 (results not shown) and we therefore attribute it to the initial transient adjustment of the model. During daytime the cumulative urban effects of Qa, Ψsky, cg and λT in the model did not increase T2m at the Sky Harbor Airport station significantly. This is due to the relatively high incoming solar radiation (maximum fluxes larger than 1000 W m-2) and an increase in heat storage flux, Qs. In Figure 5 the simulated net radiation, Rn, sensible, H, and latent λE, heat fluxes and Qs at the Sky Harbor Airport station are given for the 1998 26-category scenario. Also plotted are H and Qs for the same LULC scenario but without considering Qa, Ψsky and increased values of cg and λT. In the latter case lower daytime Qs and higher H values of about 50 W m-2 were simulated and the absolute magnitude of Qs and H were about 30 W m-2 and 15-30 W m-2 lower during nighttime (H is positive when directed away from the surface, Qs vice versa). The 2 m air temperature is a function of air temperature at the first prognostic level, T(za), and Tg. According to the prognostic temperature equation a decrease in H under otherwise unchanged conditions leads to a decrease in T(za), while an increase in Qs causes a reduction of Tg. We investigated the sensitivity of the simulated T2m regarding the choices for Qa, Ψsky, cg and λT for the urban LULC categories by changing one parameter value at a time while maintaining the other parameters at their original value. During night hours when solar radiation was zero Ψsky values of 0.7 and 0.85 led to temperatures 2 K and 0.8 K warmer than the Ψsky=1.0 scenario. Applying Qa values as described in paragraph 2b.2 as well as twice those values lead to maximum differences in nighttime T2m in comparison to the Qa=0 case of about 1 K and 2 K respectively. Using MM5’s original values of cg and λ T for the urban land/use cover classes resulted in simulated T2m of up to 1.5 K lower than those obtained after introducing the values of cg and λT listed in Table 1. The temperature differences occurred around midnight and were highest in the early morning hours. Surface Energy Fluxes (W m-2) 35 800 700 600 500 400 300 200 100 0 -100 -200 17 23 5 11 17 23 5 11 17 23 5 11 Hour (LST) Figure 5: Simulated surface energy fluxes (1998 26-category LULC scenario) for the NWS station at Sky Harbor Airport for 1700 LST 7 June 1998 to 1700 LST 10 June 1998. Plots represent (—) net radiation; (---) latent heat flux; (---) sensible heat flux, H; and (—) heat storage flux, Qs, when sky view factor, anthropogenic heat flux, increased volumetric heat storage capacity, cg, and soil thermal conductivity, λT , are considered in MM5 and (---) H; and (—) Qs when MM5’s original values for cg and λ T were used in the simulations. The modified version of the MRF scheme (Liu et al. 2004) used in this study led to a much improved agreement between simulated and observed 10 m wind speeds, V10m, during daytime in comparison to the V10m obtained with the original version of the MRF scheme which were significantly underestimated (not shown), thereby confirming results by Liu et al. (2004). However, introducing updated LULC data into MM5 did not lead to a consistent improvement of the simulated near-surface wind speeds as was found for the T2m. This is in part due to the fact that wind speeds are strongly influenced by factors other than local surface energy budget components such as the local scale heterogeneity of roughness elements. -1 Temperature Tendency (K s ) In order to evaluate the effect of the dominant physical processes on the temperature tendency at the first prognostic level, the average hourly contribution of horizontal advection, radiation fluxes, horizontal diffusion, vertical turbulent transport and anthropogenic heating is given in Figure 6 for the Sky Harbor Airport station on 9 June 1998. The cooling through radiation fluxes is strong during night and enhanced between sunset and midnight by horizontal advection. The latter causes a negative temperature trend during daytime, which is for most hours less than the positive temperature trend through vertical turbulent heat fluxes and of about the same magnitude but opposite sign as horizontal diffusion and radiation fluxes. The warming of the air due to anthropogenic heating is insignificant during daylight hours but during most of the night comparable to the magnitude of the warming effect by vertical diffusion and significantly higher for a few hours after sunset when anthropogenic heating is strongest. Adiabatic processes contribute comparably little to the temperature tendency and were not included in Figure 6. The results show that the local energy balance had a significant effect on the near-surface temperatures in the model. 0.001 0.0008 0.0006 0.0004 0.0002 0 -0.0002 -0.0004 -0.0006 -0.0008 -0.001 1 3 5 7 9 11 13 15 17 19 21 23 Hour (LST) Figure 6: Simulated hourly temperature tendency at the first prognostic level at the NWS Sky Harbor Airport station on 9 June 1998 due to (—) horizontal advection; (---) vertical turbulent transport; (—) anthropogenic heating; (---) radiation; (—) horizontal diffusion; and (—) the total tendency for the 1998 26-category land use/cover scenario. 3.2 Regional characteristics of the near-surface temperatures In order to illustrate the regional effect of changes in land cover and surface characteristics on the near-surface temperatures, areal plots of the simulated differences in T2m between the 1998 26category and MM5’s 24-category scenarios are presented for 0500 LST 9 June 1998 and 1400 LST 9 June 1998 respectively (Figure 7a and b). During the early morning (0500 LST) the introduction of the new urban land cover classes lead to an increase in the simulated T2m in the urban area of 2 to 5 K with relatively little variation depending on the urban LULC class. Instead a relatively uniform warm core, surrounded by increasingly cooler temperatures can be recognized suggesting that an expansion of the urban region may lead to an increase of temperatures in the urban center. Figure 7: Simulated differences (1998 26-category - MM5 USGS 24category scenario) in (a) 2 m air temperatures (T2m) in Kelvin for 0500 LST 9 June 1998; (b) T2m for 1400 LST 9 June 1998; (c) planetary boundary layer (PBL) heights in meters for 0500 LST 9 June 1998; and (c) 1700 LST 9 June 1998 (note the change in scale between Fig. 7a and b and Fig. 7c and d). At the time of the diurnal maximum (1400 LST, Fig. 7b) the simulations showed a much larger degree of heterogeneity throughout the region. In the case of desert being reclassified as active agriculture, or urban as mesic residential a decrease in temperature was detected. Replacing active agriculture by bare soil led to an increase in temperature, particularly in the west part of the metropolitan area. It is also worthwhile to point out that during daytime even with the 26-category 1998 scenario many parts of the city, particularly the mesic and xeric residential areas, were cooler than the desert areas to the southeast, south and southwest by about 1.5 K. This is further evidence that the urban heat island is primarily a nighttime phenomenon in the Phoenix metropolitan region. 3.3 Planetary Boundary Layer Heights Figure 8 shows the evolution of the simulated PBL heights as obtained with the original MRF scheme with the 1998 26category scenario as well as the modified scheme by Liu et al. (2004) as applied with the MM5 24-category and the 1998 26category LULC scenarios. The original MRF scheme led to higher maximum PBL heights with a more abrupt change in the morning and evening transition periods than the version by Liu et al. (2004). The latter improves the response of the simulated PBL heights to changes in the surface heat fluxes in the original MRF scheme. The results in Figure 8 show further that the LULC changes had a significant effect on the PBL height in the afternoon hours which are higher for the 1998 26-category than for the MM5 24-category LULC scenario. This is due to the change in the representation of the physical properties of the urban area in the 1998 26-category LULC scenario. The differences in the simulated boundary layer heights for the inner modeling domain at 9 June 1998 at 0500 and1700 LST between the MM5 24-category and the 1998 26-category land cover data are shown in Figure 7c and 11d. At 0500 LST differences of about 50-100 m in the PBL heights between the two LULC scenarios were simulated for the urban core area. A significant increase of more than 1000 m in the PBL heights over the central part of the city was simulated for 1700 LST which is in agreement with the results of Figure 8 at the Sky Harbor Airport station. Anderson, J. R., E. E. Hardy, J. T. Roach, and R.E. Witmer, 1976: A Land Use and Land Cover Classification System for Use with Remote Sensor Data: U.S. Government Printing Office, Washington, D.C. 4000 3500 PBL Height (m) REFERENCES 3000 2500 Defense Mapping Agency, 1992: Development of the Digital Chart of the World: Washington, D.C., U.S. Government Printing Office. 2000 1500 1000 500 0 17 23 5 11 17 23 5 11 17 23 5 11 Hour (LST) Figure 8: Simulated planetary boundary layer (PBL) heights for the NWS Sky Harbor Airport station using the (---) MM5 MRF scheme and the 1998 26-category LULC scenario; (—) MRF scheme by Liu et al. (2004) and MM5 USGS 24-category scenario; and (—) MRF scheme by Liu et al. (2004) and 1998 26-category scenario. Dudhia, J., 1996: A multi-layer soil temperature model for MM5. The 6th PSU/NCAR Mesoscale Model Users Workshop, 1996. Grossman-Clarke, S., J. A. Zehnder, W. L. Stefanov, Y. Liu, M. A. Zoldak 2005. Urban modifications in a mesoscale meteorological model and the effects on near surface variables in an arid metropolitan region. J. Appl. Met. (accepted). Guo, Y. R., and S. Chen, 1994, Terr`ain and land use for the fifthgeneration Penn State/NCAR Mesoscale Modeling System (MM5). NCAR Technical Note, NCAR/TN-397+IA. 4. CONCLUSIONS The results of this study show that a refined LULC classification for the arid Phoenix metropolitan area along with bulkapproaches for characteristics of the urban surface energy budget significantly improved the simulated diurnal temperature cycle and influenced PBL heights in MM5. The introduct ion of three urban LULC classes, which differed in terms of moisture availability, resulted in improvements in the daytime part of the diurnal 2 m temperature simulation, while including the effects of Qa, Ψsky, increased cg and λT improved the simulated nighttime temperatures. In order to apply the new LULC classification and urban parameterization with high confidence in MM5 under different synoptic conditions further studies are necessary to evaluate the model performance under those conditions. It would also be of interest to compare simulated and measured PBL heights. Approaches for the calculation of near-surface variables in the standard MM5 are based on the Monin-Obhukov similarity theory which has theoretical limitations when applied within the urban roughness sub-layer as was done in this study. Recent efforts were undertaken to develop urban canopy parameterization (UCP) schemes for mesoscale meteorological models (Masson 2000, Kusaka et al. 2004) which allow physically more sound predictions of meteorological fields within the urban roughness sub-layer. However, UCP schemes are not yet available with the standard release version of MM5 and require high-resolution data sets of the urban morphology for their parameterization. ACKNOWLEDGMENTS This research was carried out as part of the Central ArizonaPhoenix (CAP) LTER research project (NSF grant #DEB9714833). Partial financial support was also provided by the Salt River Project. We wish to thank C. Redman / N.B. Grimm, PIs on CAP LTER for their support of this research. Hope, D., C. Gries, W. X. Zhu, W. F. Fagan, C. L. Redman, N. B. G. Grimm, A. L. Nelson, Martin, C., and A. Kinzig, 2003: Socioeconomics drive urban plant diversity. Proceedings of the National Academy of Sciences of America, 100, 8788-8792. Kusaka, H., and F. Kimura, 2004: Coupling a single-layer urban canopy model with a simple atmospheric model: Impact on urban heat island simulation for an idealized case. Journal of the Meteorological Society of Japan, 82, 67-80. Liu, Y., F. Chen, T. Warner, S. Swerdlin, J. Bowers, and S. Halvorson, 2004: Improvements to surface flux computations in a non-local mixing PBL scheme, and refinements to urban processes in the NOAH land-surface model with the NCAR/ATEC real-time FDDA and forecast system. Proceedings of the 84th AMS Annual Meeting, 16th Conf. on Numerical Weather Prediction (Seattle, WA) January 12-15, 2004; paper 22.2. Masson, V., 2000: A physically-based scheme for the urban energy budget in atmospheric models. Boundary-Layer Meteorology, 94, 357-397. Sailor, D. J., and L. Lu, 2004: A top-down methodology for developing diurnal and seasonal anthropogenic heating profiles for urban areas. Atmospheric Environment, 38, 2737-2748. Stefanov, W. L., M. S. Ramsey, and P. R. Christensen, 2001: Monitoring urban land cover change: An expert system approach to land cover classification of semiarid to arid urban centers. Remote Sens. Environ., 77, 173-185. Taha, H., 1999: Modifying a mesoscale meteorological model to better incorporate urban heat storage: A bulk-parameterization approach. J. Appl. Met., 38, 466-473.
