TEMPORAL ANALYSIS OF MULTI EPOCH LANDSAT GEOCOVER IMAGES IN ZONGULDAK TESTFIELD
advertisement
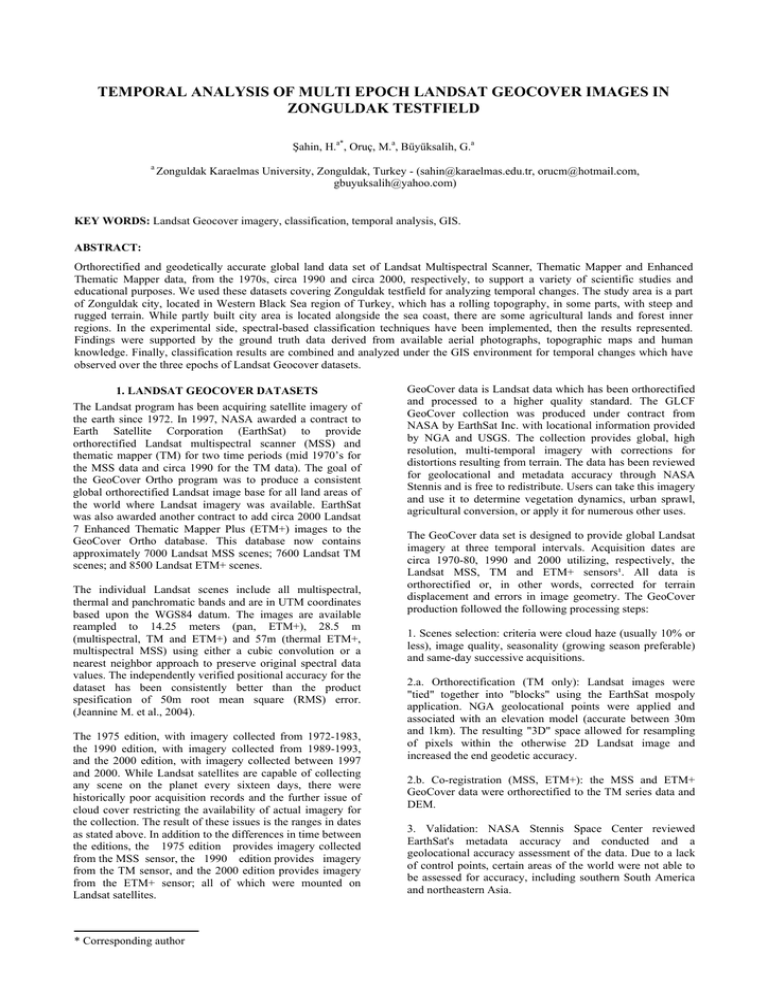
TEMPORAL ANALYSIS OF MULTI EPOCH LANDSAT GEOCOVER IMAGES IN ZONGULDAK TESTFIELD Şahin, H.a*, Oruç, M.a, Büyüksalih, G.a a Zonguldak Karaelmas University, Zonguldak, Turkey - (sahin@karaelmas.edu.tr, orucm@hotmail.com, gbuyuksalih@yahoo.com) KEY WORDS: Landsat Geocover imagery, classification, temporal analysis, GIS. ABSTRACT: Orthorectified and geodetically accurate global land data set of Landsat Multispectral Scanner, Thematic Mapper and Enhanced Thematic Mapper data, from the 1970s, circa 1990 and circa 2000, respectively, to support a variety of scientific studies and educational purposes. We used these datasets covering Zonguldak testfield for analyzing temporal changes. The study area is a part of Zonguldak city, located in Western Black Sea region of Turkey, which has a rolling topography, in some parts, with steep and rugged terrain. While partly built city area is located alongside the sea coast, there are some agricultural lands and forest inner regions. In the experimental side, spectral-based classification techniques have been implemented, then the results represented. Findings were supported by the ground truth data derived from available aerial photographs, topographic maps and human knowledge. Finally, classification results are combined and analyzed under the GIS environment for temporal changes which have observed over the three epochs of Landsat Geocover datasets. 1. LANDSAT GEOCOVER DATASETS The Landsat program has been acquiring satellite imagery of the earth since 1972. In 1997, NASA awarded a contract to Earth Satellite Corporation (EarthSat) to provide orthorectified Landsat multispectral scanner (MSS) and thematic mapper (TM) for two time periods (mid 1970’s for the MSS data and circa 1990 for the TM data). The goal of the GeoCover Ortho program was to produce a consistent global orthorectified Landsat image base for all land areas of the world where Landsat imagery was available. EarthSat was also awarded another contract to add circa 2000 Landsat 7 Enhanced Thematic Mapper Plus (ETM+) images to the GeoCover Ortho database. This database now contains approximately 7000 Landsat MSS scenes; 7600 Landsat TM scenes; and 8500 Landsat ETM+ scenes. The individual Landsat scenes include all multispectral, thermal and panchromatic bands and are in UTM coordinates based upon the WGS84 datum. The images are available reampled to 14.25 meters (pan, ETM+), 28.5 m (multispectral, TM and ETM+) and 57m (thermal ETM+, multispectral MSS) using either a cubic convolution or a nearest neighbor approach to preserve original spectral data values. The independently verified positional accuracy for the dataset has been consistently better than the product spesification of 50m root mean square (RMS) error. (Jeannine M. et al., 2004). The 1975 edition, with imagery collected from 1972-1983, the 1990 edition, with imagery collected from 1989-1993, and the 2000 edition, with imagery collected between 1997 and 2000. While Landsat satellites are capable of collecting any scene on the planet every sixteen days, there were historically poor acquisition records and the further issue of cloud cover restricting the availability of actual imagery for the collection. The result of these issues is the ranges in dates as stated above. In addition to the differences in time between the editions, the 1975 edition provides imagery collected from the MSS sensor, the 1990 edition provides imagery from the TM sensor, and the 2000 edition provides imagery from the ETM+ sensor; all of which were mounted on Landsat satellites. * Corresponding author GeoCover data is Landsat data which has been orthorectified and processed to a higher quality standard. The GLCF GeoCover collection was produced under contract from NASA by EarthSat Inc. with locational information provided by NGA and USGS. The collection provides global, high resolution, multi-temporal imagery with corrections for distortions resulting from terrain. The data has been reviewed for geolocational and metadata accuracy through NASA Stennis and is free to redistribute. Users can take this imagery and use it to determine vegetation dynamics, urban sprawl, agricultural conversion, or apply it for numerous other uses. The GeoCover data set is designed to provide global Landsat imagery at three temporal intervals. Acquisition dates are circa 1970-80, 1990 and 2000 utilizing, respectively, the Landsat MSS, TM and ETM+ sensors¹. All data is orthorectified or, in other words, corrected for terrain displacement and errors in image geometry. The GeoCover production followed the following processing steps: 1. Scenes selection: criteria were cloud haze (usually 10% or less), image quality, seasonality (growing season preferable) and same-day successive acquisitions. 2.a. Orthorectification (TM only): Landsat images were "tied" together into "blocks" using the EarthSat mospoly application. NGA geolocational points were applied and associated with an elevation model (accurate between 30m and 1km). The resulting "3D" space allowed for resampling of pixels within the otherwise 2D Landsat image and increased the end geodetic accuracy. 2.b. Co-registration (MSS, ETM+): the MSS and ETM+ GeoCover data were orthorectified to the TM series data and DEM. 3. Validation: NASA Stennis Space Center reviewed EarthSat's metadata accuracy and conducted and a geolocational accuracy assessment of the data. Due to a lack of control points, certain areas of the world were not able to be assessed for accuracy, including southern South America and northeastern Asia. Table 1, below, describes the end product validated by Stennis. Pixels are usually accurate within 50 meters or less. Radiometric characteristics correspond to those on the original Landsat satellites, although the thermal channel on the TM satellite was resampled to a 114 meter resolution. (http://www.landcover.org/data/guide/technical/geocover.sht ml). Satellite C. 1970 C. 1990 C. 2000 Sensor MSS TM ETM+ Pixel Size 57, N/A, N/A 28.5, 114, N/A 28.5, 57, 14.25 RMSe 100m 50m 50m a. Investigated area of Landsat images (red square) (https://zulu.ssc.nasa.gov/mrsid/mrsid.pl) Table 1: GeoCover Characteristics. 2. STUDY AREA AND UTILIZED DATA The test site is Zonguldak and its close vicinity, located in Western Black Sea region of Turkey. It is famous with being one of the main coal mining area in the world. Although losing economical interest, there are several coal mines still active in the region. Testfield has a rolling topography, in some parts, with steep and rugged terrain. While urbanized part is located alongside the sea coast, there are agricultural and forested areas inner regions. The elevation ranges roughly up to 1800m.(Oruc M. et al., 2004). The study area’s Landsat GeoCover images (MSS, TM and ETM+) have been shown in Fig. 1. Originally the geometric resolutions of Landsat MSS, TM and ETM+ are 80m, 30m, and 15m (30m for MS bands of ETM+) respectively. Landsat TM is 30 meters and Landsat ETM+ is 30 meters. But the individual Landsat scenes include all multispectral bands are in UTM coordinates based upon the WGS84 datum. The images are available resampled to 28.5 m (TM and ETM+) and 57m (MSS) using either a cubic convolution or a nearest neighbor approach to preserve original spectral data values. The independently verified positional accuracy for the dataset has been consistently better than the product specification of 50m root mean square (RMS) error. Radiometric Characteristics of the utilized datasets are given Table 2. Date Satellite 16.06.1975 Landsat MSS 25.07.1987 Landsat TM 21.08.2000 Landsat ETM+ Spectral Resolution (µm) Spatial Resolution (meters) 0.50-0.60 Green 0.60-0.70 Red 0.70-0.80 Near IR 0.80-1.10 Near IR 0.45-0.52 Blue 0.52-0.60 Green 0.63-0.69 Red 0.76-0.90 Near IR 1.55-1.75 Mid IR 2.08-2.35 Mid IR 0.45-0.52 Blue 0.52-0.60 Green 0.63-0.69 Red 0.76-0.90 Near IR 1.55-1.75 Mid IR 2.08-2.35 Mid IR 57 57 57 57 28.5 28.5 28.5 28.5 28.5 28.5 28.5 28.5 28.5 28.5 28.5 28.5 Table 2: Radiometric characteristics of the utilized datasets. Zonguldak b. Landsat MSS image (band 3,2,1) of the study area c. Landsat TM image (band 7,4,1) of the study area d. Landsat ETM+ image (band 3,2,1) of the study area Fig. 1: Landsat GeoCover (MSS, TM, ETM+) images of Zonguldak testfield. 3. CLASSIFICATION By the result of classification which has been made in study area, 8 classes had been produced. In this Landsat GeoCover images classification procedure, the common 8 classes which has been determined in recent studies, will be used. These determined classes are sea, damlake, density forest, forest, coal, urban, open areas and pollution of sea (Oruc M. et al., 2004). Supervised classification algorithm (Maximum-Likelihood Classification-MLC) has been applied respectively to the Landsat GeoCover images based on the determined training patterns and reference materials. For classification analysis of each Landsat GeoCover images, same training sites have been utilized with the same colour information. Reference datasets employed during the classification procedures of Landsat GeoCover images includes the topographic maps, aerial photographs, orthophotos and personal knowledge about the area. a. Result of classification for Landsat MSS Classifications have been undertaken by the related Image Works module of PCI Geomatica V9.1.6 software package and respective results are given in Fig. 2. In classification process overall accuracy and Kappa statistics results for the training areas are given in Table 3. Images Landsat MSS Landsat TM Landsat ETM+ Overall accuracy 96.01 (%) 97.18 (%) 97.54 (%) Kappa 0.90 0.97 0.97 Table 3: Accuracy assessments for training areas. Additional to determined classes, it is seen that there is a cloud class in MSS and TM images. ETM+ image doesn’t include this cloud class. The assessments of cloud class hasn’t used as a class but only has been shown on the images. b. Result of classification for Landsat TM Classification accuracy in remote sensing is to determine the agreement between the selected reference materials and the classified data. For this purpose, 250 sample pixels in the study have been selected randomly and their agreement with ground truth has been analyzed. Then, error matrix has been generated. Table 4 includes not only the producer’s and the user’s accuracy and kappa statistics values are given but also the overall accuracy and overall kappa statistic are mentioned. In addition accuracy assessments of supervised classifications are given separately for Landsat MSS, Landsat TM and Landsat ETM+ images in Table 4. 4. TEMPORAL ANALYSIS When we look at the results of accuracy assessment of supervised classification, it is seen that sea class has been separated 100% in all three images. In Fig. 3, it is seen that the area which is shown by number 1 and 5, is urban area. In Fig. 3 and it was seen that the urban area is not so much. In Fig. 3 b and e, it was seen that, this urban area is growing. In Fig. 3 c and f, the urban area is growing more. The area which is shown by number 2 is the pollution of sea affected by thermal power plant of Zonguldak city. This power plant is constructed in 1977 and because of that the pollution not available in Fig. 3a. But also, in Fig. 3 b and c, this affect can be seen easily. c. Result of classification for Landsat ETM+ Fig. 2: Results of supervised classification (MaximumLikelihood Classification) for Landsat GeoCover images. The area which is shown by number 3 is artificial lake. Its construction has been started in 1985. So, in Fig. 3a the lake is not available. This construction area is seen easily 1987 Landsat TM classified image. The constructed lake is also available in 2000 Landsat ETM+ classified image. The area shown by number 4 is Zonguldak Kozlu damlake, which is constructed for collecting drinking water of Zonguldak city. This damlake was constructed in 1979. Because of that, it is not available in 1975 MSS classified image, but it can be seen easily in Landsat TM and ETM+ classified image. Class Name Sea damlake density forest forest coal urban open areas pollution of sea Overall Accuracy % Overall Kappa Statistic Producer's Accuracy % 100.000 0.000 83.721 Landsat MSS User's Accuracy % 100.000 0.000 80.000 83.333 0.000 3.030 10.714 - 42.453 0.000 33.333 50.000 - 1.000 0.000 0.758 Producer's Accuracy % 100.000 33.333 77.143 Landsat TM User's Accuracy % 100.000 100.000 52.941 0.266 0.000 0.232 0.436 - 39.063 0.000 3.226 89.655 0.000 67.568 0.000 100.000 36.111 0.000 Kappa Statistic 1.000 1.000 0.452 Producer's Accuracy % 100.000 33.333 81.081 Landsat ETM+ User's Accuracy % 100.000 100.000 51.724 0.564 0.000 1.000 0.277 0.000 41.667 0.000 16.129 77.419 0.000 59.524 0.000 62.500 45.283 0.000 Kappa Statistic 69.600 67.200 69.200 0.594 0.577 0.601 Kappa Statistic 1.000 1.000 0.433 0.467 0.000 0.572 0.375 0.000 Table 4: Accuracy assessment of supervised classifications 2 3 1 6 5 4 d. MSS a. MSS 2 3 1 3 6 5 4 e. TM b. TM 2 1 3 6 5 4 c. ETM+ f. ETM+ Fig. 3: Temporal analysis of Landsat GeoCover images. The area shown by number 6 is Zonguldak Eregli damlake. Construction of this damlake has been started in 1991. So it is available only in 2000 Landsat ETM+ classified image. 5. CONCLUSION As classification result of Landsat GeoCover MSS, TM and ETM+ images, it has been realized that there are a lot of temporal changes in Zonguldak test field. Especially, the construction period of damlakes, these changes can be seen. Although, the expansion and dispersion of the urban area can be specified easily by classified images. When we look at the classification result, the temporal changes can be seen easily and clearly from the classified Landsat GeoCover TM and ETM+ images, because of the pixel size 28.5m and the same bands. 6. REFERENCES Akcin H., Oruc M., Büyüksalih G., 2004: Remotely Sensing And GIS Based Analysis Of The Detection Of Landcoverage Changes Arising From Coal Production Wastes In Zonguldak Metropolitan Area-Turkey, ISPRS XX. Congress, Istanbul. Charles M. S., Vicki Z., Debbie F., 2004: Geopositional Accuracy Assesment Of Earthsat Geocover Landsat Orthorectified Imagery, ASPRS Annual Conference Proceedings. Jeannine M., David C., Eric W., Gregory K., 2004: Deriving Products From Geocover Ortho Imagery, ASPRS Annual Conference Proceedings. Jon D., 2004: Landsat-7 Definitive Ephemeris: An Independent Verification Of Geocover-Ortho 1990 Positional Accuracy, ASPRS Annual Conference Proceedings. Oruç, M., Marangoz, A.M., Büyüksalih, G., 2004: Comparison of Pixel-based and Object-oriented Classification Approaches Using LANDSAT-7 ETM Spectral Bands, ISPRS XXth Congress, Istanbul. http://www.landcover.org/data/guide/technical/geocover.shtm l. https://zulu.ssc.nasa.gov/mrsid/mrsid.pl.
