COMPARING LANDCOVER PATTERNS IN TOKYO, KYOTO, AND TAIPEI USING
advertisement
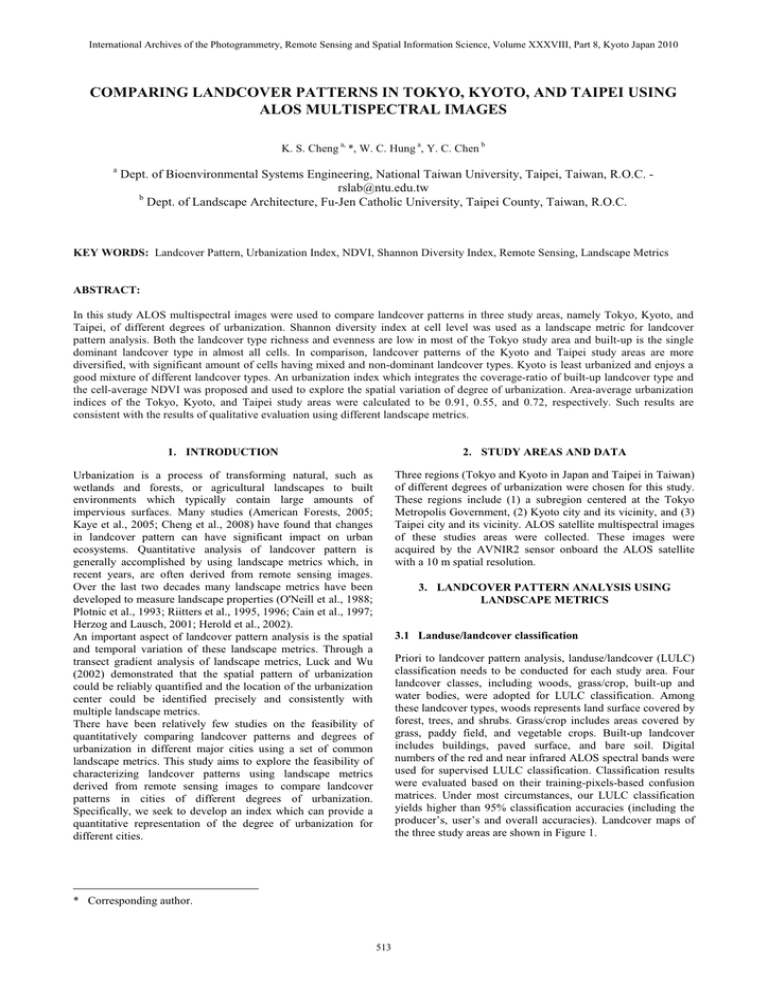
International Archives of the Photogrammetry, Remote Sensing and Spatial Information Science, Volume XXXVIII, Part 8, Kyoto Japan 2010 COMPARING LANDCOVER PATTERNS IN TOKYO, KYOTO, AND TAIPEI USING ALOS MULTISPECTRAL IMAGES K. S. Cheng a, *, W. C. Hung a, Y. C. Chen b a Dept. of Bioenvironmental Systems Engineering, National Taiwan University, Taipei, Taiwan, R.O.C. rslab@ntu.edu.tw b Dept. of Landscape Architecture, Fu-Jen Catholic University, Taipei County, Taiwan, R.O.C. KEY WORDS: Landcover Pattern, Urbanization Index, NDVI, Shannon Diversity Index, Remote Sensing, Landscape Metrics ABSTRACT: In this study ALOS multispectral images were used to compare landcover patterns in three study areas, namely Tokyo, Kyoto, and Taipei, of different degrees of urbanization. Shannon diversity index at cell level was used as a landscape metric for landcover pattern analysis. Both the landcover type richness and evenness are low in most of the Tokyo study area and built-up is the single dominant landcover type in almost all cells. In comparison, landcover patterns of the Kyoto and Taipei study areas are more diversified, with significant amount of cells having mixed and non-dominant landcover types. Kyoto is least urbanized and enjoys a good mixture of different landcover types. An urbanization index which integrates the coverage-ratio of built-up landcover type and the cell-average NDVI was proposed and used to explore the spatial variation of degree of urbanization. Area-average urbanization indices of the Tokyo, Kyoto, and Taipei study areas were calculated to be 0.91, 0.55, and 0.72, respectively. Such results are consistent with the results of qualitative evaluation using different landscape metrics. 1. INTRODUCTION 2. STUDY AREAS AND DATA Urbanization is a process of transforming natural, such as wetlands and forests, or agricultural landscapes to built environments which typically contain large amounts of impervious surfaces. Many studies (American Forests, 2005; Kaye et al., 2005; Cheng et al., 2008) have found that changes in landcover pattern can have significant impact on urban ecosystems. Quantitative analysis of landcover pattern is generally accomplished by using landscape metrics which, in recent years, are often derived from remote sensing images. Over the last two decades many landscape metrics have been developed to measure landscape properties (O'Neill et al., 1988; Plotnic et al., 1993; Riitters et al., 1995, 1996; Cain et al., 1997; Herzog and Lausch, 2001; Herold et al., 2002). An important aspect of landcover pattern analysis is the spatial and temporal variation of these landscape metrics. Through a transect gradient analysis of landscape metrics, Luck and Wu (2002) demonstrated that the spatial pattern of urbanization could be reliably quantified and the location of the urbanization center could be identified precisely and consistently with multiple landscape metrics. There have been relatively few studies on the feasibility of quantitatively comparing landcover patterns and degrees of urbanization in different major cities using a set of common landscape metrics. This study aims to explore the feasibility of characterizing landcover patterns using landscape metrics derived from remote sensing images to compare landcover patterns in cities of different degrees of urbanization. Specifically, we seek to develop an index which can provide a quantitative representation of the degree of urbanization for different cities. Three regions (Tokyo and Kyoto in Japan and Taipei in Taiwan) of different degrees of urbanization were chosen for this study. These regions include (1) a subregion centered at the Tokyo Metropolis Government, (2) Kyoto city and its vicinity, and (3) Taipei city and its vicinity. ALOS satellite multispectral images of these studies areas were collected. These images were acquired by the AVNIR2 sensor onboard the ALOS satellite with a 10 m spatial resolution. 3. LANDCOVER PATTERN ANALYSIS USING LANDSCAPE METRICS 3.1 Landuse/landcover classification Priori to landcover pattern analysis, landuse/landcover (LULC) classification needs to be conducted for each study area. Four landcover classes, including woods, grass/crop, built-up and water bodies, were adopted for LULC classification. Among these landcover types, woods represents land surface covered by forest, trees, and shrubs. Grass/crop includes areas covered by grass, paddy field, and vegetable crops. Built-up landcover includes buildings, paved surface, and bare soil. Digital numbers of the red and near infrared ALOS spectral bands were used for supervised LULC classification. Classification results were evaluated based on their training-pixels-based confusion matrices. Under most circumstances, our LULC classification yields higher than 95% classification accuracies (including the producer¶s, user¶s and overall accuracies). Landcover maps of the three study areas are shown in Figure 1. * Corresponding author. 513 International Archives of the Photogrammetry, Remote Sensing and Spatial Information Science, Volume XXXVIII, Part 8, Kyoto Japan 2010 near point A, the higher degree of urbanization the city is. Thus, it can be seen clearly from Fig. 3 that Tokyo study area is most urbanized with very low coverage ratio of woods or grass/crop landcover type. The Taipei study area has majority of its cells concentrated near built-dominant point A, although there are also many cells falling along a curved path near the AB line (Fig. 3(c)). Such pattern is a reflection of the fact that the Taipei study area encompasses mountainous regions at its northeastern and southeastern corners. Comparing to the Tokyo and Taipei study areas, concentration of cells near built-dominant point A is less significant for the Kyoto study area. Cells are more widely spread over the coverage-ratio plane, indicating a good mixture of different landcover types within the Kyoto study area. It also indicates that the Kyoto study area is least urbanized among the three study areas. Figure 1. Landcover images of the three study areas. 3.2 Landscape metrics for landcover pattern analysis In this study landcover pattern analysis is achieved by quantitatively assessing two components ± (1) landcover heterogeneity within individual local cells of 1 km x 1 km coverage and (2) variation of such landcover heterogeneity over the whole study area, using ALOS multispectral images. Landcover heterogeneity within a cell is expressed by the Shannon diversity index (SHDI) defined as k (1) SHDI p ln( p ) ¦ i i i 1 where pi is the area percentage of the i-th landcover type within the cell and k is the number of different landcover types. Variation of cell-level landcover heterogeneity over the study area is characterized by the empirical cumulative distribution function (ECDF) of SHDI. Spatial variation and ECDF of these cell-level SHDI are shown in Figure 2. It can be seen clearly that cell-level SHDI values of the Tokyo study area are more homogeneous in space, due to its low SHDI standard deviation, and are generally lower. It indicates that both the landcover type richness and evenness are low in most of the Tokyo study area. The Tokyo study area is highly urbanized and built-up is the single dominant landcover type in almost all cells. In contrast, Kyoto and Taipei study areas have more significant spatial variation of cell-level SHDI. Their SHDI standard deviations are much higher than the Tokyo study area. Landcover patterns of these two cities show more diversified landcover distribution, i.e. in addition to cells for which woods and built-up are dominant landcover types (with very low SHDI), there are also significant amount of high-SHDI cells which have mixed and non-dominant landcover types. Fihure 3. Landcover pattern in coverage-ratio space. (a) Schematic illustration showing regions of different dominant landcover types. (b) ± (d) Existing landcover patterns in the Tokyo, Kyoto, and Taipei study areas, respectively. 4. ASSESSING THE DEGREE OF URBANIZATION USING AN URBANIZATION INDEX Figure 2. Spatial variation of cell-level SHDI. 3.3 Landcover patterns in coverage-ratio space Each cell is associated with four area percentages (i.e. coverage ratios) corresponding to landcover types of woods, crop/grass, built-up, and water bodies. Figure 3(a) demonstrates that, neglecting the coverage ratio of water bodies, all cells should fall on a plane (hereafter referred to as the coverage-ratio plane) defined by three vertices (points A, B, and C) of dominant landcover types. Urbanization can be viewed as a process of cells on the coverage-ratio plane merging from points B (woods dominant) and C (crop/grass dominant) towards the confluence point A (built-up dominant). The more concentrated these cells 514 Although the spatial variation and ECDF of cell-level SHDI can reveal differences in landcover patterns of different study areas, they do not provide an explicit and direct measurement of urbanization. Similarly, the cell distribution in the coverageratio space can only serve as a visually and qualitative indicator of the degree of urbanization. An urbanization index (UI) which not only reflects the characteristics of urbanization, but also provides a comparable scale is worth pursuing. The most apparent effect of urbanization is the increase of builtup landcover. As the process of urbanization continues, the built-up dominant areas expand and the coverage ratio of builtup landcover type increases. However, modern urban planning and zoning may also require establishing urban forestry or city parks and planting of road trees to alleviate the adverse effect of urbanization. Presence of trees, parks, and forestry in a neighborhood can be reflected by higher cell-average NDVI values. There exist a few definitions of urbanization index in the literature, including the ratio of apartment houses in total construction housing (Kouichi, 1987), road density and percentage of built area (Lee et al., 2004), and the ratio of building coverage per unit area (Chen, 2007). These indices basically use the percentage of built area to quantify the degree of urbanization, and fail to consider the effect of vegetation cover. Thus, we propose to develop a cell-specific urbanization International Archives of the Photogrammetry, Remote Sensing and Spatial Information Science, Volume XXXVIII, Part 8, Kyoto Japan 2010 index by integrating the coverage-ratio of built-up landcover type and the cell-average NDVI (Hung et al., 2010): (2) UI cell pb (1 NDVI cell ) where pb represents the coverage-ratio of built-up landcover type of individual cells. The value of cell-specific urbanization index can vary between 0 and 2 since 1 d NDVI cell d 1 . In reality, most UI cell values fall in between 0 and 1, and higher UI cell values indicate more significant effect of urbanization. For an overall comparison of the degrees of urbanization of the three study areas, average urbanization index UI for each study area was calculated. Value of UI for the Tokyo, Kyoto, and Taipei study areas are 0.91, 0.55, and 0.72, respectively. These values are consistent with the qualitative evaluation of the degree of urbanization as previously described. Variation of cell-specific urbanization index can also be displayed in a two-dimensional space to explore the city center and areas with higher degrees of urbanization. Figure 4 demonstrates UI cell contour maps of the three study areas. The Tokyo study area has higher than 0.8 UI cell values over most of its coverage, and is clearly most urbanized among the three study areas. Taking UI cell t 1.0 as a criterion, the most urbanized district in each of the three study areas can be identified. For the Kyoto study area, the most urbanized district falls within an area restricted between two rivers (the Kamogawa and Katsuragawa) flowing through the city. In contrast, the Taipei study area is dissected by the Damsui River and three most urbanized districts can be identified. As for the Tokyo study area, the most urbanized district is located in the surrounding of the Tokyo Metropolitan Office, including several busiest wards in Tokyo. Generally speaking, these identified most urbanized districts are in agreement with areas of highest population density of the three study areas, indicating the capability of UI cell as a measure of the degree of Figure 4. Two-dimensional gradient analysis of the cell-specific urbanization index of the Tokyo, Kyoto, and Taipei study areas. (3) Comparing to the Tokyo and Taipei study areas, Kyoto is least urbanized and enjoys a good mixture of different landcover types, based on the analysis of landcover pattern in coverage-ratio space. (4) Area-average urbanization index for the Tokyo, Kyoto, and Taipei study areas are 0.91, 0.55, and 0.72, respectively. Such results are consistent with the results of qualitative evaluation using different landscape metrics. The cell-specific urbanization index can also be used for two-dimensional gradient analyses to show the spatial variation of the degree of urbanization within each study area. urbanization. Such gradient analysis can also be conducted for the same study area over different time periods to reveal the spatiotemporal trend of urbanization. It is also worthy to note that, since the proposed cell-specific urbanization index integrates the effects of built-up coverage and NDVI, there exists a potential for study of urban heat island using the proposed urbanization index. REFERENCES American Forests, 2005. Urban Ecosystem Analysis City of Jacksonville Florida. Washington, D.C., USA. Cain, D.H., Riitters, K., Orvis, K., 1997. A multi-scale analysis of landscape statistics. Landscape Ecology, 12, 199±212. 5. CONCLUSIONS In this paper we demonstrate the feasibility of identifying and comparing landcover patterns in three study areas, namely Tokyo, Kyoto, and Taipei, of different degrees of urbanization, using ALOS multispectral images. Landcover patterns in different study areas were compared, through comparison of the cell-level Shannon diversity index and distribution of cells in landcover coverage-ratio space. An urbanization index which can be used as a measure of degree of urbanization is also developed by integrating the coverage-ratio of built-up landcover type and the cell-average NDVI. A few concluding remarks are drawn as follows: (1) Both the landcover type richness and evenness are low in most of the Tokyo study area. The Tokyo study area is highly urbanized and built-up is the single dominant landcover type in almost all cells. (2) Landcover patterns of the Kyoto and Taipei study areas show more diversified landcover distribution. In addition to cells for which woods and built-up are dominant landcover types, there are also significant amount of cells with mixed and non-dominant landcover types. Chen, L., 2007. Land use/cover change and environmental effects. 2007-USA-AZU Bilateral Workshop. Research Center for Eco-Environmental Sciences, Chinese Academy of Sciences. http://www.asu.edu/chinainitiatives/Workshop_2/2007_USAAZU_ChenLiding.pdf. Cheng, K.S., Su, Y.F., Kuo, F.T., Hung, W.C., Chiang, J.L., 2008. Assessing the effect of landcover on air temperature using remote sensing images - A pilot study in northern Taiwan. Landscape and Urban Planning, 85(2), 85-96. Herold, M., Scepan, J., Clarke, K.C., 2002. The use of remote sensing and landscape metrics to describe structures and changes in urban land uses. Environment and Planning A, 34, 1443- 1458. Herzog, F., Lausch, A., 2001. Suplementing land-use statistics with landscape metrics: some methodological considerations. Environmental Monitoring and Assessment, 72, 37±50. 515 International Archives of the Photogrammetry, Remote Sensing and Spatial Information Science, Volume XXXVIII, Part 8, Kyoto Japan 2010 Hung, W.C., Chen, Y.C., Cheng, K.S., 2010. Comparing landcover patterns in Tokyo, Kyoto, and Taipei using ALOS multispectral images. Landscape and Urban Planning, in press. Kaye, J.P., Mcculley, R.L., Burke, I.C., 2005. Carbon fluxes, nitrogen cycling, and soil microbial communities in adjacent urban, native and agricultural ecosystems. Global Change Biology, 11, 575±587. Kouichi, I., 1987. Study on the estimation method of residential land use index in Tokyo metropolitan area. Journal of architecture, planning and environmental engineering, Transactions of Architectural Institute of Japan, 375, 114-125 (in Japanese). Lee, P., Ding, T., Hsu, F., Geng, S., 2004. Breeding bird species richness in Taiwan: distribution on gradients of elevation, primary productivity and urbanization. Journal of Biogeography, 31, 307±314. Luck, M., Wu, J., 2002. A gradient analysis of urban landscape pattern: a case study from the Phoenix metropolitan region, Arizona, USA. Landscape Ecology, 17, 327±339. O'Neill, R.V., Krummel, J.R., Gardner, R.H., Sugihara, G., Jackson, B., DeAngelis, D.L., Milne, B.T., Turner, M.G., Zygmunt, B., Christensen, S.W., Dale, V.H., and Graham, R.L., 1988. Indices of landscape pattern. Landscape Ecology, 1, 153162. Plotnic, R.E., Gardner, R.H., 2¶1HLOO R.V., 1993. Lacunarity indices as measures of landscape texture. Landscape Ecology, 8, 201-211. Riitters, K.H., 2¶1HLOl, R.V., Hunsaker, C.T., Wickham, J.D., Yankee, D.H., Timmins, S.P., Jones, K.B., Jackson, B.L., 1995. A factor analysis of landscape pattern and structure metrics. Landscape Ecology, 10, 23-39. Riitters, K.H., O'Neill, R.V., Wickham, J.D., Jones, K.B., 1996. A note on contagion indices for landscape analysis. Landscape Ecology, 11, 197-202. ACKNOWLEDGEMENTS We are grateful to the Japan Aerospace Exploration Agency (JAXA) for providing ALOS images used in this study through an ALOS Research Agreement (PI-355). The corresponding author also thanks Dr. Kiyoshi Torii of the Kyoto University for providing valuable suggestions and information. 516
