PHOTOGRAMMETRIC MONITORING OF UNDER WATER EROSION IN THE
advertisement
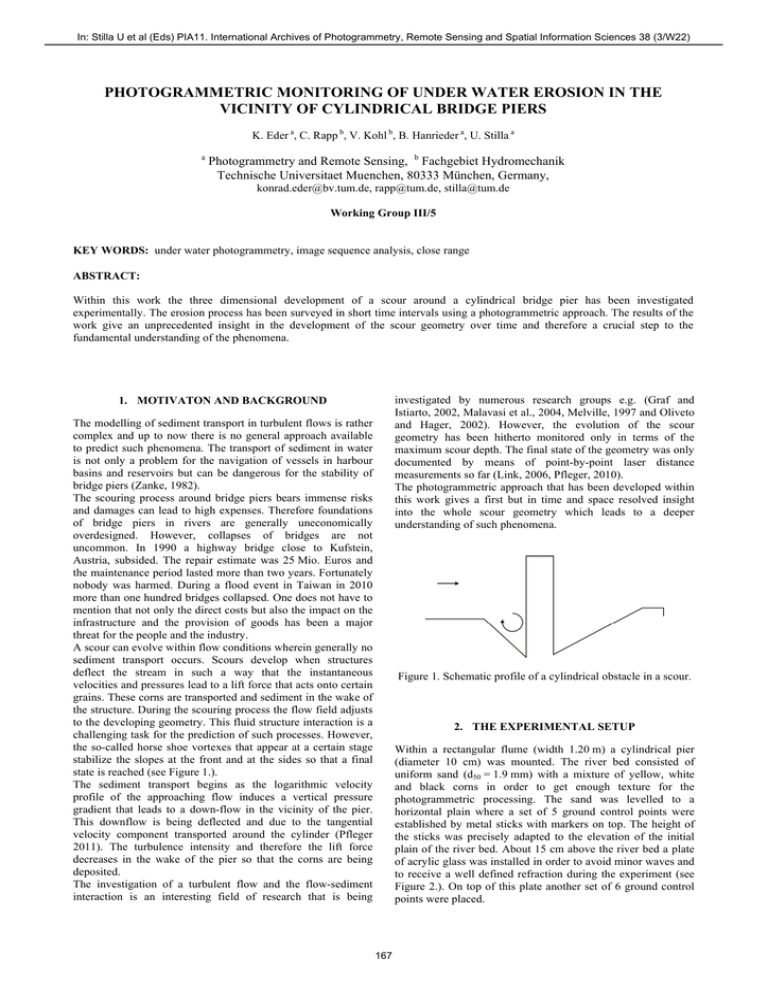
In: Stilla U et al (Eds) PIA11. International Archives of Photogrammetry, Remote Sensing and Spatial Information Sciences 38 (3/W22) PHOTOGRAMMETRIC MONITORING OF UNDER WATER EROSION IN THE VICINITY OF CYLINDRICAL BRIDGE PIERS K. Eder a, C. Rapp b, V. Kohl b, B. Hanrieder a, U. Stilla a a Photogrammetry and Remote Sensing, b Fachgebiet Hydromechanik Technische Universitaet Muenchen, 80333 München, Germany, konrad.eder@bv.tum.de, rapp@tum.de, stilla@tum.de Working Group III/5 KEY WORDS: under water photogrammetry, image sequence analysis, close range ABSTRACT: Within this work the three dimensional development of a scour around a cylindrical bridge pier has been investigated experimentally. The erosion process has been surveyed in short time intervals using a photogrammetric approach. The results of the work give an unprecedented insight in the development of the scour geometry over time and therefore a crucial step to the fundamental understanding of the phenomena. investigated by numerous research groups e.g. (Graf and Istiarto, 2002, Malavasi et al., 2004, Melville, 1997 and Oliveto and Hager, 2002). However, the evolution of the scour geometry has been hitherto monitored only in terms of the maximum scour depth. The final state of the geometry was only documented by means of point-by-point laser distance measurements so far (Link, 2006, Pfleger, 2010). The photogrammetric approach that has been developed within this work gives a first but in time and space resolved insight into the whole scour geometry which leads to a deeper understanding of such phenomena. 1. MOTIVATON AND BACKGROUND The modelling of sediment transport in turbulent flows is rather complex and up to now there is no general approach available to predict such phenomena. The transport of sediment in water is not only a problem for the navigation of vessels in harbour basins and reservoirs but can be dangerous for the stability of bridge piers (Zanke, 1982). The scouring process around bridge piers bears immense risks and damages can lead to high expenses. Therefore foundations of bridge piers in rivers are generally uneconomically overdesigned. However, collapses of bridges are not uncommon. In 1990 a highway bridge close to Kufstein, Austria, subsided. The repair estimate was 25 Mio. Euros and the maintenance period lasted more than two years. Fortunately nobody was harmed. During a flood event in Taiwan in 2010 more than one hundred bridges collapsed. One does not have to mention that not only the direct costs but also the impact on the infrastructure and the provision of goods has been a major threat for the people and the industry. A scour can evolve within flow conditions wherein generally no sediment transport occurs. Scours develop when structures deflect the stream in such a way that the instantaneous velocities and pressures lead to a lift force that acts onto certain grains. These corns are transported and sediment in the wake of the structure. During the scouring process the flow field adjusts to the developing geometry. This fluid structure interaction is a challenging task for the prediction of such processes. However, the so-called horse shoe vortexes that appear at a certain stage stabilize the slopes at the front and at the sides so that a final state is reached (see Figure 1.). The sediment transport begins as the logarithmic velocity profile of the approaching flow induces a vertical pressure gradient that leads to a down-flow in the vicinity of the pier. This downflow is being deflected and due to the tangential velocity component transported around the cylinder (Pfleger 2011). The turbulence intensity and therefore the lift force decreases in the wake of the pier so that the corns are being deposited. The investigation of a turbulent flow and the flow-sediment interaction is an interesting field of research that is being Figure 1. Schematic profile of a cylindrical obstacle in a scour. 2. THE EXPERIMENTAL SETUP Within a rectangular flume (width 1.20 m) a cylindrical pier (diameter 10 cm) was mounted. The river bed consisted of uniform sand (d50 = 1.9 mm) with a mixture of yellow, white and black corns in order to get enough texture for the photogrammetric processing. The sand was levelled to a horizontal plain where a set of 5 ground control points were established by metal sticks with markers on top. The height of the sticks was precisely adapted to the elevation of the initial plain of the river bed. About 15 cm above the river bed a plate of acrylic glass was installed in order to avoid minor waves and to receive a well defined refraction during the experiment (see Figure 2.). On top of this plate another set of 6 ground control points were placed. 167 PIA11 - Photogrammetric Image Analysis --- Munich, Germany, October 5-7, 2011 Camera position flow directon Sensor name focal length (mm) X0 (mm) PIV_24_left 24.0180 -0.0356 PIV_24_right 24.0301 0.0654 Y0 (mm) 0.0190 0.0291 rad. distortion (A1) -2.2183E-004 -2.5384E-004 (A2) 1.2675E-005 1.0594E-005 Table 1. Parameters of interior orientation obtained from testfield calibration Acrylic glas control point pilar The exterior orientation was reconstructed using the ground control points established on top of the acrylic glass plate, to ensure that there is no displacement of the image ray by acrylic glass and water. The exterior orientation was considered to be constant for the complete image sequence since the camera position did not change. For image matching a proper texture is necessary. A pre-experimental work (Hanrieder, 2010) has shown that a mixture of sand with 10% white and 20% dark particles supplies an optimal texture for image matching. Figure 3 shows a section around the pillar with the mixture of the sediment. The selected image pairs where then imported into the LPS and assigned with the exterior orientation from the 0-state image pair. For DEM extraction different strategy parameters were tested. The best result was obtained with a modified parameter set of “rolling hills”. Water Sediment Figure 2. Schematic sketch of the experimental set up Two digital cameras with a focal length of 24 mm were mounted approximately 2.5 meter above the channel. The used cameras are components of a Particle Image Velocimetry (PIV) system and have a detector array of 4 Megapixels. The camera configuration was calibrated by test field calibration and allows acquiring stereoscopic images taken at the same time. The challenge in this experiment was to investigate the performance of photogrammetric image matching through the plate of acrylic glass and water. In a first step, the whole setup was imaged without water in order to determine the control points and the riverbed. We call the situation of riverbed the 0-state or “dry state”. In the next step, water was flooded to a level just up to the acrylic glass. Again images were taken to study the effect of “under water” image matching. Then the water flow was activated to an extent, where the scour began to form up. With the synchronized cameras images were taken with a 1 Hz time interval over a period of two hours. During the experiment, about 7200 image pairs were acquired and stored. According to experiences made in previous experiments 42 image pairs have been selected for further processing representing the time resolution as follows: - Duration of experiment: 0 – 30 minutes: 1 minutes interval - Duration of experiment: 30 -60 minutes: 5 minutes interval - Duration of experiment: 60 -120 minutes: 10 minutes interval Figure 3. The pillar and sediment mixture at 0-state 3. PHOTOGRAMMETRIC PROCESSING 3.1 Preparation The photogrammetric processing chain was carried out with the Leica Photogrammetry Suite (LPS), Leica Geosytems, where the parameters especially for image matching had to be optimized for this special application. Precondition for any photogrammetric approach is the reconstruction of the interior and exterior orientation of the camera. The interior orientation parameters for the PIV cameras were determined by test field calibration. The results are given in table1. Figure 4. Image of the left camera superimposed with matched points The image pairs were than processed in batch mode returning about 8000 well distributed object points (Figure 4). 168 In: Stilla U et al (Eds) PIA11. International Archives of Photogrammetry, Remote Sensing and Spatial Information Sciences 38 (3/W22) The set up of the control points within this experiment allows for the computation of the differences between “observed“ and “true” points. Since the control points can be measured through air/acryl/water media and their real position is known from the installation, the differences can be calculated (Table 2). The pier itself caused some occlusions and miss matchings in its near surroundings. These areas were cropped in the final DTM in order to avoid errors in the volume calculation. From this point cloud a regular grid (spacing 10 mm) was generated. These DEM provided the base for further volume calculations to study the sediment transportation. A visualisation of the final DEM (state 119) is given in figure 5. The differences show that the displacement in height is much larger than in planimetry. To compensate the error in this experiment, a rather simple but effective method was applied: The point clouds were transformed by a 7 parameter transformation (shift, rotation, scale), using the five stick points as identical points for the calculation of the transformation parameters. Table 2 shows in the last three columns the residuals at the control points after transformation. This transformation compensates the error at the river bed level, but cannot serve as a rigorous model for the correction of the complete scene. Point Nr. 900 901 902 903 904 Δx [cm] 0,37 0,57 -0,25 -0,36 0,16 Δy [cm] 0,82 0,48 0,46 0,89 0,99 Δz [cm] 6,33 6,71 6,92 6,97 6,59 res. x [cm] 0.12 -0.06 -0.04 0.06 -0.07 res. y [cm] 0.08 0.02 0.01 -0.01 -0.10 res. z [cm] 0.06 0.02 0.02 0.02 -0.08 Table 2. Differences at control points before and after 3D Transformation Figure 5. Perspective view of the DEM (state 119 sec.) 4. HYDROMECHANICAL ANALYSIS The experiment was conducted at 80% of the critical velocity where sediment transport takes place in an undisturbed flow. The DEM give a clear insight in the evolution process of a scour around a cylindrical bridge pier. This three dimensional geometry information over time has hitherto not been published. 3.2 Three media photogrammetry As stated before, the special challenge of this project was to consider the fact, that three media are involved. Tracing the ray from the camera position to the object point it first crosses the acrylic glass plate and then enters into the water (Figure 6). The refraction indices of these media are: • Air 1.0 • Acrylic glass 1.49 • Water 1.33 deepest point The effect of different media in close range photogrammetry has been a topic of research during the last decades (Höhle 1971; Wrobel, 1975; Li et al., 1997; Butler et al., 2002; Maas, 2008). Also the under water calibration of cameras was investigated (Fryer and Fraser, 1986) Figure 7. DEM after 17 Minutes. Flow is from lower left to upper right. Figure 7 shows the DEM-after 17 min of the scouring process and differences between state 1019 and state 0. One can see the cut of sediment around the cylinder with its centre at (x,y) = (0,0). The grains of sand are being transported by the flow and deposited in the wake of the bridge pier. The scour evolves approximately circularly around the pier and extends to about 5 cm around the cylinder. From the figure one can see that the deepest point is not at the pier front. Figure 6. Three media refraction and point displacement 169 PIA11 - Photogrammetric Image Analysis --- Munich, Germany, October 5-7, 2011 Mass Balance 0.001 0.0009 0.0008 Mass [m³] 0.0007 0.0006 above 0.0005 0.0004 below 0.0003 sum 0.0002 0.0001 0 0 2000 4000 6000 8000 10000 Time [s] Figure 9. Cut/fill and mass balance during scour development Figure 8. DEM after one hour. Flow is from lower left to upper right. This effect explains the offset of the mass balance that is applied right at the beginning. However, the mass balance reaches a maximum after one hour and decreases to the end of the experiment. In between 2500 s and 7000 s the mass gain/loss diminishes nearly as expected. The mass decreases after about 7000 s as the more and more particles are transported out of the observation area (see above). However, the mass gain cannot be explained physically, so that further investigations have to be carried out. Figure 8 shows the elevation model one hour after the beginning of the scouring process. The hole has become slightly deeper and wider. The width of the deposition hill corresponds to the width of the scour hole. The end of the hill is approaching the limit of the observation area. In this period of the scouring process the horseshoe vortex system is already stabilizing the geometry. The so called horseshoe vortex system is a characteristic flow structure that evolves around a pier. The current is being deflected downwards by the pier and at the bottom upstream (see Fig. 1) inducing a vortex. This vortex is being transported around the pier before it separates (=horseshoe) and drifts downstream in the wake of the cylinder (Unger and Hager, 2007). Its upward facing component holds the particles at their places so that the slope is steeper than the angle of repose. 5. CONCLUSION AND OUTLOOK A first insight has been given into the three dimensional time dependent evolution of a scour hole around a cylindrical bridge pier. The highly resolved DEMs can help to explain the complex flow structures that are evolving in such situations. However, the data has to be validated more thoroughly in order to fulfil the requirement of a conservative mass balance. A first approach would take the impact of ray distortion on the elevation model into account. A correction algorithm that uses control points at different levels will be applied. The plot shows a growing scour that extends to about 10 cm to the pier front. The deepest point travelled to the pier front and a cut of material can clearly be seen in the wake of the hill. The area of deposition has also increased in time. Its width again corresponds to the width of the scour however its length has increased by about 50% in comparison to the former state. Interestingly the hill foot has been shifted downstream by at least 5 cm. For continuing former investigations of a single (Pfleger, 2010) a particle tracking algorithm can monitor the movement of the grains within sequences. First results of the vector field are shown in Figure 10. camera setup be applied to these image promising as The transformed and corrected DEM served as input for volume calculation for studying the sediment transportation, especially cut and fill for the selected states representing the sediment movement. One can expect that cut and fill are in the same order such that the mass balance should be nearly zero. The result of the volume calculation is represented graphically in Figure 9. It shows a positive mass balance over the duration of the experiment. At the beginning (state 0 – state 119) there is a rather large discrepancy. However, Figures 7 and 8 show a clear positive deposition in the remote areas, which can have its origin in general transport in the undisturbed flow. Figure 10. Visualization of tracked particles 170 In: Stilla U et al (Eds) PIA11. International Archives of Photogrammetry, Remote Sensing and Spatial Information Sciences 38 (3/W22) Unger, J.; Hager, W.H. (2007) Down-ow and horseshoe vortex characteristics of sediment embedded bridge piers. In: Exp Fluids 42; 1-19 REFERENCES Butler, J.B.; Lane, S.N.; Chandler, J.H.; Porfiri, E. (2002) Through-water close range digital photogrammetry in flume and field environments. Photogrammetric Record, 17 (72): 419439 Wrobel, B. (1975) Mehrmedien-Photogrammetrie – ein aktuelles Betätigungsfeld der Photgrammetrie. Vermessungswesen und Raumordnung, 37(1) Fryer, J.; Fraser, C. (1986) On the calibration of underwater cameras. Photogrammetric Record, 12 (67): 73-85 Zanke, U. C. E. (1982) Grundlagen der Sedimentbewegung. Berlin: Springer Graf, W.H.; Istiarto, I. (2002) Flow pattern in scour hole around a cylinder. Journal of Hydraulic Research 40 (1): 13-20 Hanrieder, B. (2010) Photogrammetrische Vermessung von Sedimentoberflächen für Strömungsversuche, Bachelor’s Thesis. München: Technische Universtät München, Photogrammetry and Remote Sensing Höhle, J. (1971) Zur Theorie und Praxis der UnterwasserPhotogrammetrie. Schriften der DGK, Reihe C, Heft 163. Li, R.; Li, H.; Zou W.; Smith R. G.; Curran, T. A (1997) Quantitative photogrammetric analysis of digital underwater video imagery. IEEE Journal of Oceanic Engineering, 22(2): 364-375 Link, O.; Pfleger, F.; Zanke, U. (2006) Automatic non-intrusive measurement of scour-hole geometry. In: Verheij, H., Hoffmans, G. (eds) Proceedings to the Third International Conference on Scour and Erosion. The Netherlands, Gouda: CURNET, 403Maas, H.-G. (1992) Digitale Photogrammetrie in der dreidimensonaöen Strömungsmesstechnik. Dissertation Nr. 9665, Zürich: ETH Maas, H.-G. (2008) New developments in multimedia photogrammetry. Institute of Geodesy and Photogrammetry, Swiss Federal Institute of Technology Malavasi, S.; Radice, A.; Ballio, F. (2004) Study of sediment motion in a local scour hole through an image processing technique. In: Proceedings to River flow 2004, II Int. Conf. on Fluvial Hydraulics; 535-542 Melville, B. W. (1997) Pier and abutment scour: integrated approach. In: Journal of Hydraulic Engineering 123 (2):125-136 Oliveto, G.; Hager, W. H. (2002) Temporal evolution of clearwater pier and abutment scour. Journal of Hydraulic Engineering 128 (9): 811-820 Pfleger, F. (2011) Experimentelle Untersuchung der Auskolkung um einen zylindrischen Brückenpfeiler. Dissertation. München: Technische Universität München, Fakultät für Bauingenieur- und Vermessungswesen Pfleger, F.; Rapp, Ch.; Manhart, M. (2010) Analysis of the temporal evolution of the sediment movement in the vicinity of a cylindrical bridge pier. In: Burns, S. E.; Bhatia, S. K.; Avila, C. M. C.; Hunt, B. E. (eds) Proceedings to the Fifth International Conference on Scour and Erosion, Geotechnical Special Publication No.210, 658-667 171
