Atmospheric aerosol properties – a Baltic sea case study based... A. Krusper and P. Philipson
advertisement
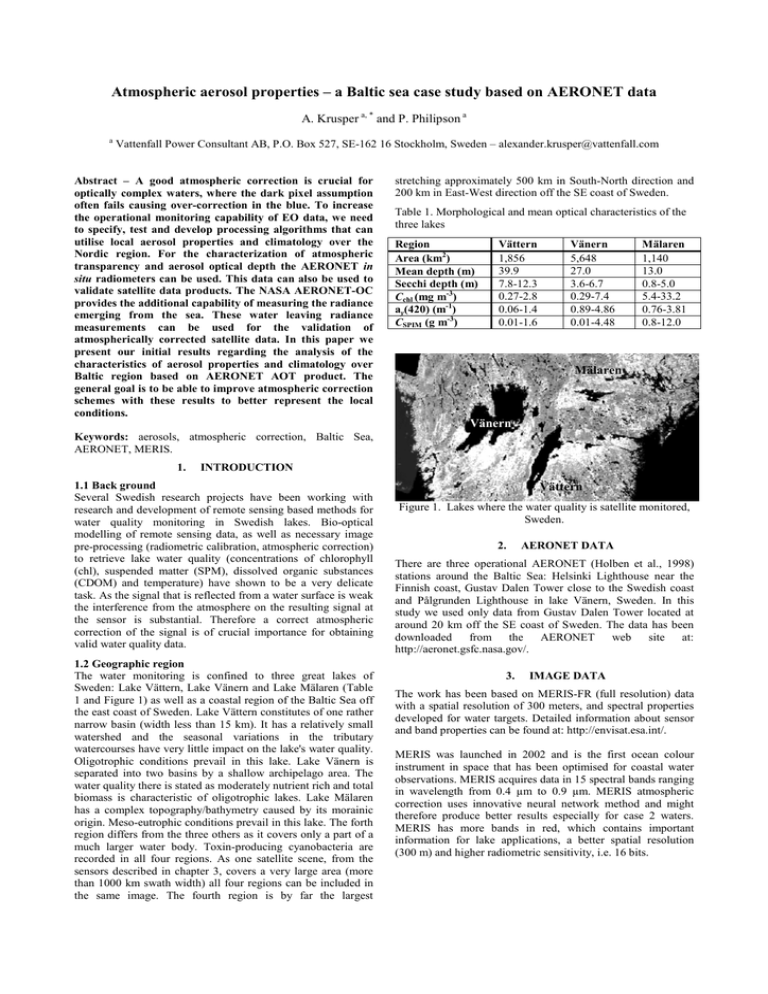
Atmospheric aerosol properties – a Baltic sea case study based on AERONET data A. Krusper a, * and P. Philipson a a Vattenfall Power Consultant AB, P.O. Box 527, SE-162 16 Stockholm, Sweden – alexander.krusper@vattenfall.com Abstract – A good atmospheric correction is crucial for optically complex waters, where the dark pixel assumption often fails causing over-correction in the blue. To increase the operational monitoring capability of EO data, we need to specify, test and develop processing algorithms that can utilise local aerosol properties and climatology over the Nordic region. For the characterization of atmospheric transparency and aerosol optical depth the AERONET in situ radiometers can be used. This data can also be used to validate satellite data products. The NASA AERONET-OC provides the additional capability of measuring the radiance emerging from the sea. These water leaving radiance measurements can be used for the validation of atmospherically corrected satellite data. In this paper we present our initial results regarding the analysis of the characteristics of aerosol properties and climatology over Baltic region based on AERONET AOT product. The general goal is to be able to improve atmospheric correction schemes with these results to better represent the local conditions. stretching approximately 500 km in South-North direction and 200 km in East-West direction off the SE coast of Sweden. Table 1. Morphological and mean optical characteristics of the three lakes Region Area (km2) Mean depth (m) Secchi depth (m) Cchl (mg m-3) ay(420) (m-1) CSPIM (g m-3) Vättern 1,856 39.9 7.8-12.3 0.27-2.8 0.06-1.4 0.01-1.6 Vänern 5,648 27.0 3.6-6.7 0.29-7.4 0.89-4.86 0.01-4.48 Mälaren 1,140 13.0 0.8-5.0 5.4-33.2 0.76-3.81 0.8-12.0 Mälaren Vänern Keywords: aerosols, atmospheric correction, Baltic Sea, AERONET, MERIS. 1. INTRODUCTION 1.1 Back ground Several Swedish research projects have been working with research and development of remote sensing based methods for water quality monitoring in Swedish lakes. Bio-optical modelling of remote sensing data, as well as necessary image pre-processing (radiometric calibration, atmospheric correction) to retrieve lake water quality (concentrations of chlorophyll (chl), suspended matter (SPM), dissolved organic substances (CDOM) and temperature) have shown to be a very delicate task. As the signal that is reflected from a water surface is weak the interference from the atmosphere on the resulting signal at the sensor is substantial. Therefore a correct atmospheric correction of the signal is of crucial importance for obtaining valid water quality data. 1.2 Geographic region The water monitoring is confined to three great lakes of Sweden: Lake Vättern, Lake Vänern and Lake Mälaren (Table 1 and Figure 1) as well as a coastal region of the Baltic Sea off the east coast of Sweden. Lake Vättern constitutes of one rather narrow basin (width less than 15 km). It has a relatively small watershed and the seasonal variations in the tributary watercourses have very little impact on the lake's water quality. Oligotrophic conditions prevail in this lake. Lake Vänern is separated into two basins by a shallow archipelago area. The water quality there is stated as moderately nutrient rich and total biomass is characteristic of oligotrophic lakes. Lake Mälaren has a complex topography/bathymetry caused by its morainic origin. Meso-eutrophic conditions prevail in this lake. The forth region differs from the three others as it covers only a part of a much larger water body. Toxin-producing cyanobacteria are recorded in all four regions. As one satellite scene, from the sensors described in chapter 3, covers a very large area (more than 1000 km swath width) all four regions can be included in the same image. The fourth region is by far the largest Vättern Figure 1. Lakes where the water quality is satellite monitored, Sweden. 2. AERONET DATA There are three operational AERONET (Holben et al., 1998) stations around the Baltic Sea: Helsinki Lighthouse near the Finnish coast, Gustav Dalen Tower close to the Swedish coast and Pålgrunden Lighthouse in lake Vänern, Sweden. In this study we used only data from Gustav Dalen Tower located at around 20 km off the SE coast of Sweden. The data has been downloaded from the AERONET web site at: http://aeronet.gsfc.nasa.gov/. 3. IMAGE DATA The work has been based on MERIS-FR (full resolution) data with a spatial resolution of 300 meters, and spectral properties developed for water targets. Detailed information about sensor and band properties can be found at: http://envisat.esa.int/. MERIS was launched in 2002 and is the first ocean colour instrument in space that has been optimised for coastal water observations. MERIS acquires data in 15 spectral bands ranging in wavelength from 0.4 µm to 0.9 µm. MERIS atmospheric correction uses innovative neural network method and might therefore produce better results especially for case 2 waters. MERIS has more bands in red, which contains important information for lake applications, a better spatial resolution (300 m) and higher radiometric sensitivity, i.e. 16 bits. 4. RESEARCH BACKGROUND Remote sensing of dark targets such as lakes is a delicate task. The surface reflectance is seldom above 10% and the atmospheric contribution to the signal can be several times greater than the actual surface signal. It is therefore critical to perform an, for the area and time, appropriate atmospheric correction, in order to be able to use the image data for biooptical modelling of water quality parameters. The radiative transfer model 6S (Vermote et.al., 1997), developed by the Laboratoire d'Optique Atmospherique in Lille, France, was used in one of the previous research projects (Philipson at al., 2006) for the atmospheric correction of image data. The 6S code gives the possibility to use predefined models included in the code or user defined models and input. The input parameters and models in 6S describe the atmospheric conditions, aerosol model and concentration, target and sensor altitude, band definitions, definition of the target and environment reflectance and latitude and longitude of the target and, azimuth and zenith angles of the sun and sensor. Using this model for atmospheric correction of the airborne remote sensing data collected during the research projects showed good results, compared to field measured spectra. Consequently, 6S was tested for atmospheric correction of SeaWiFS, MODIS and MERIS data, with less promising results and it was decided inappropriate for the present project, even though usage of MERIS has given in better results than SeaWiFS or MODIS (Reinart & Pierson, 2004). In addition, parallel investigations showed that the standard atmospheric correction routines, developed for SeaWiFS and MODIS by the data producers, often failed over large lakes (Reinart et. al. 2002, 2003). The problem is overestimation of atmospheric influence. Aznay & Santer (2009) have used AERONET data to validate the MERIS aerosol models and concluded that MERIS algorithm systematically overestimates the AOT at 865 nm. For further information about the standard routines for MERIS data we refer to: http://envisat.esa.int/instruments/meris/pdf/. As the MERIS standard products were decided inappropriate for the waters studied here another atmospheric correction algorithm has been used (Schroeder at al., 2007). The algorithm (“MERIS/FUB”) is developed with emphasis on case-2 waters and is based on inverse modelling of radiative transfer (RT) calculations and neural network techniques. The improvement is especially visible in the blue part of the spectrum where MERIS Level-2 product yields an error of 122 % compared with 19 % for this algorithm. (Schroeder at al., 2007) 5. AOT VALUE COMPARISON Even though the MERIS/FUB has been a large improvement there is still problems and potential for further development. The availability of AERONET data makes it tempting to use the data for, to start with, evaluating the quality of atmospheric correction results from the algorithms used, and, as a next step, to use the data to calibrate and improve the algorithms. In this study we have compared AOT values calculated from MERIS data with FUB-algorithm with AOT values from AERONET station Gustav Dalen Tower. The comparison has been made for two years 2008 and 2010 and dates where both MERIS data and AERONET data were available (Table 2). The period of the year that the data was considered useful was from the 1st of April to the 30th of September. In total we compared data from 14 MERIS overpasses for 2008, and 19 for 2010 (Table 2). Table 2. Days for which both MERIS and AERONET data were available. April May June July August 2008 29 09, 11, 12 01, 03, 04, 07, 25 23, 24, 28, 30, 31 2010 21, 24 02, 04, 06, 15, 20, 22, 23, 24, 27 03, 07, 16, 19, 20 05, 14, 23 The AOT data derived from MERIS were collected from the AOT product in geocorrected image as average values over a 3x3 pixel matrix centered over the position of Gustav Dalen Tower. The 3x3 matrix is used to compensate for geocorrection error of the images. AOT values available were at wavelengths of 440 nm, 550 nm, 670 nm and 870 nm. The Gustav Dalen Tower AERONET data used were of the best quality level available for the respective year (level 2.0 for 2008 and level 1.5 for 2010). The values used for comparison were calculated as average over a two hours period (time for MERIS overpass +/- 1 hour). The wavelengths used were chosen to be as near as possible to MERIS’s ditto: 443 nm, 555 nm, 670 nm and 870 nm. The limited amount of data didn’t allow for a statistical evaluation of data, but still, the comparison reveals some interesting, albeit difficult to interpret, facts. On some days there is a remarkable overestimation of AOT in MERIS/ANN compared to AERONET data throughout the studied wavelengths (Figure 2 and 4). High discrepancy is present when MERIS data contain clouds (N.B. not over target) and, as it seems to be, due to presence of, for instance, cyanobacteria in the water. The largest discrepancy is visible for July 30, 2008 where both clouds and cyanobacteria are present (Figure 3). Figure 2. Comparison of AOT values for 2008 obtained from MERIS/ANN and AERONET. Figure 4. Comparison of AOT values for 2010 obtained from MERIS/ANN and AERONET. Figure 3. Processed MERIS data image from July 30, 2008 showing chlorophyll content in the water. Clouds are shown in white. Position of Gustav Dalen Tower is marked by white cross. The results of the comparison indicate that there is a potential in using AERONET data for improving atmospheric correction of MERIS data. However, in order to be able to come to more reliable conclusions a lot more work needs to be done. One of the problems is that AERONET data have a good coverage in time but very limited in space. Just the opposite can be said of MERIS data – MERIS gives good coverage in space but quite limited coverage in time (considering the need for clear skies and enough sunlight). The next step in continuation of the study is to include also data from Pålgrunden AERONET station. Here it is not only interesting to see how that data corresponds to data from MERIS/ANN but also to analyse how the AOT values from the two AERONET stations vary relative each other. Yet another problem is the variability of aerosol content and type (Reinart et al., 2003 and 2008). The strength of AERONET data is that it provide input of in situ measurements of local conditions. REFERENCES O. Aznay and R. Santer, “MERIS atmospheric correction over coastal waters: validation of the MERIS aerosol models using AERONET”, International Journal of Remote sensing, vol. 30, No. 18, 4663-4684, 20 September 2009. B. N. Holben, T. F. Eck, I. Slutsker, D. Tanré, J. P. Buis, A. Setzer, E. Vermote, J. A. Reagan, Y. J. Kaufman, T. Nakajima, F. Lavenu, I. Jankowiak and A. Smirnov, “AERONET – A Federateed Instrument Network and Data Archive for Aerosol Characterization”, Remote Sens. Environ. 66:1-13 (1998), Elsvier Science Inc. 1998. P. Philipson, A. Reinart and S. Kratzer, “Atmospheric correction of remote sensing data for operational lake water quality monitoring”, Swedish National Space Board, Scientific Report, Dnr. 75/06, 2006. A. Reinart, Ü. Kikas and E. Tamm, “Aerosol components and types in the Baltic Sea region”, Boreal Environment Research 13: 103-112, 28 April 2008. A. Reinart and D. Pierson, “Water quality monitoring of large European lakes using MERIS full resolution data”, Proc. of the 2004 Envisat & ERS Symposium. Salzburg, Austria, 6-10 September 2004 (ESA SP 572, April 2005) A. T. Reinart, A. E. Reinart and D. Pierson, “Effect of local aerosol optical properties to the atmospheric correction of SeaWiFS and MODIS images over the Baltic Sea region”, Proc. 30th International Symposium on remote sensing of Environment, Honolulu, Hawaii, 2003. A. Reinart, P. Land and D. Pierson, “Large European lakes in SeaWiFS and MODIS images”, Proc. of Ocean Optics XVI, Santa Fe, USA, 2002. Th. Schroeder, I. Behnert, M. Schaale, J. Fischer and R. Doerffer, “Atmospheric correction algorithm for MERIS above case-2 waters”, International Journal of Remote Sensing, Vol. 28, No. 7, 1469-1486, 10 April 2007. E.F. Vermote, D. Tanré, J.L. Deuzé, M. Herman and J.J. Morcrette, “Second simulation of the satellite signal in the solar spectrum, 6S, An Overview”, IEEE Transactions on Geoscience and Remote Sensing, 35 (3), 675-686, 1997. ACKNOWLEDGEMENTS We are grateful to Giuseppe Zibordi, the principal investigator of Gustav Dalen Tower AERONET station. We are also very grateful to the staff of the Tartu Observatory, Estonia, for valuable inputs, patience and hospitality. This work has been done as part of WaterS, a FP7 People project.
