USING INSAR FOR SEISMOTECTONIC OBSERVATIONS OVER THE MW 6.3
advertisement
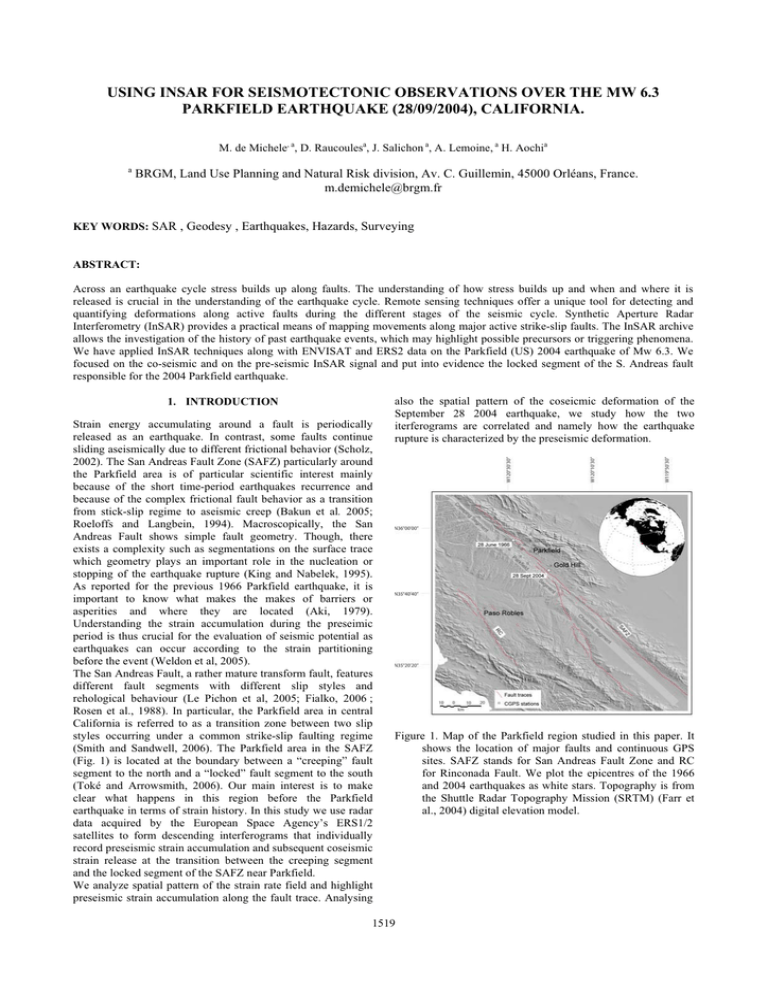
USING INSAR FOR SEISMOTECTONIC OBSERVATIONS OVER THE MW 6.3 PARKFIELD EARTHQUAKE (28/09/2004), CALIFORNIA. M. de Michele, a, D. Raucoulesa, J. Salichon a, A. Lemoine, a H. Aochia a BRGM, Land Use Planning and Natural Risk division, Av. C. Guillemin, 45000 Orléans, France. m.demichele@brgm.fr KEY WORDS: SAR , Geodesy , Earthquakes, Hazards, Surveying ABSTRACT: Across an earthquake cycle stress builds up along faults. The understanding of how stress builds up and when and where it is released is crucial in the understanding of the earthquake cycle. Remote sensing techniques offer a unique tool for detecting and quantifying deformations along active faults during the different stages of the seismic cycle. Synthetic Aperture Radar Interferometry (InSAR) provides a practical means of mapping movements along major active strike-slip faults. The InSAR archive allows the investigation of the history of past earthquake events, which may highlight possible precursors or triggering phenomena. We have applied InSAR techniques along with ENVISAT and ERS2 data on the Parkfield (US) 2004 earthquake of Mw 6.3. We focused on the co-seismic and on the pre-seismic InSAR signal and put into evidence the locked segment of the S. Andreas fault responsible for the 2004 Parkfield earthquake. 1. INTRODUCTION Strain energy accumulating around a fault is periodically released as an earthquake. In contrast, some faults continue sliding aseismically due to different frictional behavior (Scholz, 2002). The San Andreas Fault Zone (SAFZ) particularly around the Parkfield area is of particular scientific interest mainly because of the short time-period earthquakes recurrence and because of the complex frictional fault behavior as a transition from stick-slip regime to aseismic creep (Bakun et al. 2005; Roeloffs and Langbein, 1994). Macroscopically, the San Andreas Fault shows simple fault geometry. Though, there exists a complexity such as segmentations on the surface trace which geometry plays an important role in the nucleation or stopping of the earthquake rupture (King and Nabelek, 1995). As reported for the previous 1966 Parkfield earthquake, it is important to know what makes the makes of barriers or asperities and where they are located (Aki, 1979). Understanding the strain accumulation during the preseimic period is thus crucial for the evaluation of seismic potential as earthquakes can occur according to the strain partitioning before the event (Weldon et al, 2005). The San Andreas Fault, a rather mature transform fault, features different fault segments with different slip styles and rehological behaviour (Le Pichon et al, 2005; Fialko, 2006 ; Rosen et al., 1988). In particular, the Parkfield area in central California is referred to as a transition zone between two slip styles occurring under a common strike-slip faulting regime (Smith and Sandwell, 2006). The Parkfield area in the SAFZ (Fig. 1) is located at the boundary between a “creeping” fault segment to the north and a “locked” fault segment to the south (Toké and Arrowsmith, 2006). Our main interest is to make clear what happens in this region before the Parkfield earthquake in terms of strain history. In this study we use radar data acquired by the European Space Agency’s ERS1/2 satellites to form descending interferograms that individually record preseismic strain accumulation and subsequent coseismic strain release at the transition between the creeping segment and the locked segment of the SAFZ near Parkfield. We analyze spatial pattern of the strain rate field and highlight preseismic strain accumulation along the fault trace. Analysing also the spatial pattern of the coseicmic deformation of the September 28 2004 earthquake, we study how the two iterferograms are correlated and namely how the earthquake rupture is characterized by the preseismic deformation. Figure 1. Map of the Parkfield region studied in this paper. It shows the location of major faults and continuous GPS sites. SAFZ stands for San Andreas Fault Zone and RC for Rinconada Fault. We plot the epicentres of the 1966 and 2004 earthquakes as white stars. Topography is from the Shuttle Radar Topography Mission (SRTM) (Farr et al., 2004) digital elevation model. 1519 The International Archives of the Photogrammetry, Remote Sensing and Spatial Information Sciences. Vol. XXXVII. Part B4. Beijing 2008 2. INSAR OBSERVATION ON THE PARKFIELD EARTHQUAKE 2.1 InSAR evidence of pre-seismic strain accumulation We have examined the preseismic deformation field recorded by space-based InSAR (Interferometric Synthetic Aperture Radar) in the Parkfield area. InSAR can map ground deformation at a decameter spatial resolution with subcentimeters precision in the line of sight direction (LOS) (Massonnet and Feigl, 1998). The San Andreas fault north of Parkfield undergoes continuous creep at an average rate of ~3 cm/yr (Toké and Arrowsmith, 2006). Atmospheric delays in the radar scenes of the interferometric pair (Zebker et al, 1997) could mask this kind of signal in a single interferogram. We therefore constructed the InSAR velocity field by averaging 30 selected unwrapped interferograms (Raucoules et al., 2003; Le Mouélic et al., 2005) calculated over the preseismic period 1993-2004, prior to the September 28 2004 earthquake. With this procedure, the effect of atmospheric delay is minimized as it is assumed to be uncorrelated with time. Considering the simple mechanism of the strike-slip faulting regime of this region, we can rule out substantial contribution of vertical fault slip in this area of the SAFZ (Titus et al., 2006; Murray and Langbein, 2006 ) and assume that the InSAR signal is only due to horizontal surface fault slip. The result is, therefore, a velocity map (Fig. 2) showing right lateral shear distribution over 141 km of the San Andreas Fault centred in the Parkfield area prior to the 28 September 2004 earthquake. A prominent feature of strain accumulation in the Gold Hill area highlighted in the preseismic interferogram stack is the abrupt spatial decrease of creeping rate along the SAFZ towards Gold Hill, where relative creep velocity reaches a local minimum (Fig. 3). This suggests either a change in the rheological material properties or a bend in the fault strike resulting in increasing friction towards Gold Hill. 30 km further south-east of Gold Hill, at the beginning of the Cholame segment, relative surface velocity increases to moderate values (~0.7 cm/yr) indicating the re-starting of surface creep. This spatially discontinuous change in the mode of slip suggests the presence of a stronger section of the fault between Gold Hill and Cholame that acts as a barrier locking the fault sub-segment south of Gold Hill. We will see further how this feature played a significant role in the nucleation of the 2004 Parkfield earthquake. Figure 3. Differential velocity profile showing creep rate variation along the strike of the SAFZ (measured at ~1 km from the fault) during the preseismic period 1992-2004. We built this profile according to the methodology described in (de Michele and Briole, 2007). Notice the abrupt decrease in creep rate towards a local minimum south of Gold Hill where the future 2004 earthquake epicenter is located (red star). White squares represent minima in the preseismic creep rate profile indicating other possible stronger sections of the fault. Figure 2. Preseismic strain buildup on the SAFZ at Parkfield. The map is composed by averaging 20 unwrapped ERS1/2 interferograms in a stack. Each 20x20 m pixel is then a measure of the average LOS velocity in the period 19922004 prior to the earthquake. The scale-bar values represent centimeters parallel to the fault. To do this, we assume there are no vertical tectonic movements and we projected LOS velocity into the horizontal velocity component parallel to the fault strike. We plot 2004 earthquake rupture (in red) as well as the epicenter position (white star). CO=coalinga subsidence, LH=Lost Hills subsidence, KND=Kettleman North Dome subsidence, PR=Paso Robles subsidence. Black and white crosses indicate the position of the profiles used for extracting the differential profile in Figure 3. Subsidence due to water pumping in the Paso Robles sub-unit (Valentine et al., 1997) manifested as a bull eye shaped range change pattern south of Parkfiel is a marked feature in the presismic interferogram. Similar features though smaller in area can be observed in the northern sector of the preseismic interferogram (Fig 2). These correspond to petroleum and gas withdrawal from a shallow reservoir in the Lost Hills field and neighbouring reservoirs (Fielding et al., 1998, Brink et al., 2002). Pumping-induced vertical motion is a source of nontectonic lateral signal inhomogeneities thus considered as noise for the purpose of our study. Moreover, such a transversal anisotropy in the deformation pattern is not considered by simple elastic dislocation models that rather assume the Earth’s crust to respond as a laterally homogeneous and isotropic body. Therefore, no simple dislocation model is able to perfectly match hence explain our preseismic observations made with InSAR data. For the same reason we were not able to de-trend InSAR data by fitting a plane, whose estimation would be arbitrary. Our InSAR observations are therefore meant to be relative as are other geodetic techniques. 1520 The International Archives of the Photogrammetry, Remote Sensing and Spatial Information Sciences. Vol. XXXVII. Part B4. Beijing 2008 2.2 InSAR evidences of co-seismic strain release We then used radar data from ERS-2 satellite to form interferograms that records co-seismic surface deformation of the September 28 2004 Parkfield event. The ERS-2 satellite experienced gyroscope failure in 2001. However, we could use 4 selected radar scenes among the ERS-2 dataset to construct coherent interferograms. Atmospheric phase contribution is a major limiting factor in the precision of a single interferogram. We minimize the atmospheric contribution to the coseismic signal by averaging two coherent coseismic interferograms spanning 950 and 490 days, respectively. It has to be noted that with such an important time lapse, aseismic deformation contributes significantly to interferometric signal in masking co-seismic deformation. Thus, we estimate aseismic phase contribution according to each time lapse from the aforementioned pre-seismic interferogram and remove pertinent aseismic contribution from each individual co-seismic interferogram before stacking. The results show a LOS spatially detailed coseismic surface displacement and provide a map of the surface that ruptured during the September 28 2004 Parkfield earthquake (Fig. 4). We observe that the earthquake rupture extends from south of Gold Hill and ruptured North West toward Middle Mountain forming discontinuous breaks on the north western side of Cholame Valley, which is consistent with field observations (Rymer et al., 2006). We observe that the rupture developed along at least 35 km of the SAFZ. Coseismic surface deformation is consistent with a dextral strike slip mechanism. We measure maximum coseismic slip of up to 15 cm LOS, which makes ~21 cm horizontal displacement assuming that the vertical coseismic slip component is negligible. We compared our coseismic InSAR results with permanent GPS solutions (www.usgs.gov; Johanson et al.). GPS permanent stations were installed in the framework of the Earthquake Prediction Experiment at Parkfield (Roeloffs and Langbein, 1994). InSAR results are briefly in good agreement with continuous coseismic GPS solutions that captured the coseismic signal about 20 km north-west of the epicenter. indicates northward propagation of the earthquake surface deformation as if a stronger section of the fault (-a barrier) limited dynamic propagation towards the south. We plotted coseismic GPS solutions from permanent stations for comparison (black arrows). One of the most salient features in the co-seismic interferogram is the abrupt arrest of the rupture south of Gold Hill accompanied by a sharp transient in the surface deformation field. This observation implies the presence of a local structural control (Sibson, 1985) or earthquake barrier (Klinger et al, 2006) that may govern the propagation (Aochi et al, 2005) and stopping of rupture as well as the propagation of surface deformation. 3. DISCUSSION AND CONCLUSIONS The spatial pattern of the preseismic InSAR deformation rate (Fig. 2) indicates that strain distribution is not uniformly repartitioned along the fault strike. We observe that the spatially continuous abrupt decrease in the creep rate measured by preseismic InSAR data on the Parkfield segment of the San Andreas Fault reaches a minimum south of Gold Hill before gently increasing again. We notice how the preseismic surface deformation pattern highlights strain accumulating towards a stronger section of the San Andreas Fault south of God Hill. The identification and geographic location of an earthquake barrier or asperity is of major importance. Interseismic barriers might act as stress concentrators thus playing an important role in starting the earthquake rupture. It is known by seismological analyses that the 2004 rupture propagated northward unless the 1966 one (2). Our InSAR coseismic interferogram show how the surface rupture extends north of the epicenter on the SAFZ while south of Gold Hill the earthquake rupture bends abruptly and culminates. The InSAR coseismic deformation pattern follows the same trend as deformation lobes do not extend gently off the southern tip of the rupture as one would expect in a simple coseismic strike-slip shear regime. This is evidence of the presence of either structural or geometric features south of Gold Hill on the SAFZ that acted as a kinetic barrier opposing rupture propagation. The barrier is well localized at the transition between two different modes of aseismic slip on the SAFZ and it is geographically well correlated with the barrier assumed by observing strain accumulating in the preseismic interferograms stack. Therefore, we are spotting the location of a highly probable earthquake such as the 2004 Parkfield. In this case, our InSAR results would have helped the planning of ground instrumentation network in the vicinity of the future epicenter. Long wavelength lateral signal heterogeneities partly due to subsidence phenomena observed in the preseismic interferogram hamper simple elastic modelling of preseismic strain build-up. We jointly interpret preseismic and coseismic InSAR observations as evidences of the presence of a local structural/geometrical control that governs strain accumulation and consequent earthquake nucleation. We conclude that the spatially detailed constructed SAR interferograms have the capability to highlight inhomogeneities in the strain history of a region and allow us to identify the area of potential earthquake nucleation. Figure 4. Unwrapped coseismic ERS-2 interferogram. Surface deformation in the LOS direction is consistent with a dextral strike-slip mechanism. The inferred surface rupture 1521 The International Archives of the Photogrammetry, Remote Sensing and Spatial Information Sciences. Vol. XXXVII. Part B4. Beijing 2008 22. M. J. Rymer et al. Bull. Seismol. Soc. Am. 96, 11-27 (2006). References 1. C. H. Scholz, The Mechanics of Earthquakes and Faulting (Cambridge University Press, London, 2002). [second edition]. 23. http://quake.usgs.gov/research/deformation/twocolor/pkf_ continuous_gps.html (2007). 2. W. H Bakun et al. Nature 437, 969-974 (2005). 24. I. Johanson et al. Bull. Seismol. Soc. Am. 96, 269-282 (2006). 3. E. Roeloffs, J. Langbein. Rev. Geophys. 32, 315-336 (1994). 25. R. H. Sibson. Nature 316, 248-251 (1985). 4. G. C. King, J. Nabelek. Science 283, 984-987 (1985). 26. Y. Klinger, R. Michel. G. C. P. King. Earth Planet. Sci. Lett. 242, 354-364 (2006). 5. K. Aki. J. Geophys. Res. 84, 6140-6148 (1979). 6. R. J. Weldon, T. E. Fumal, G. P. Biasi, K. M. Scharer. Science 308, 966–967 (2005). 27. H. Aochi, R. Madriaga, E. Fukuyama. Geochem. Geophy. Geosy. 4, doi:10.1029/2001GC000207 (2005). 7. X. Le Pichon, C. Kreemer, N. Chamot-Rooke. J. Geophys. Res 110, doi:10.1029/2004JB003343 (2005). 31. 8. Y. Fialko. Nature 44, 968-971 (2006). 32. M. de Michele, P. Briole. Geophys. J. Int. 169, 357–364 (2007). 9. P. Rosen, et al. Geophys. Res. Lett. 25, 825-828 (1988). 10. B. R. Smith, D. T. Sandwell. J. Geophys. Res. 111, Doi :10.1029/2005JB003703 (2006). 11. N. A. Toké, J. R. Arrowsmith. Bull. Seismol. Soc. Am. 96, 339-348 (2006). T. G. Farr et al. Rev. doi:10.1029/2005RG000183 (2004). Geophys. 45, ACKNOWLEDGEMENTS SAR data have been made available by ESA though the CAT-1 project proposal. Authors wish to thank BRGM research division for funding this study. 12. D. Massonnet, K. L. Feigl. Rev. Geophys. 36, 441-500 (1998). 13. H. A. Zebker, P. A. Rosen, H. Hansley. J. Geophys. Res. 102, 7547-7563 (1997). 14. S. Le Mouélic, D. Raucoules, C. Carnec, C. King. Photogram. Eng. Rem. S. 71, 197-204 (2005). 15. D. Raucoules et al., Remote. Sen. Environ. 88, 468-478 (2003). 16. J. Biggs, T. Wright, Z. Lu, B. Parsons. Geophys. J. Int. 170, 1165-1179 (2007). 17. S. J. Titus, C. De Mets, B. Tikoff. Bull. Seismol. Soc. Am. 96, 250-268 (2006). 18. J. Murray, J. Langbein. Bull. Seismol. Soc. Am. 96, 283-303 (2006). 19. D. W. Valentine et al., “Use of InSAR to identify landsurface displacement caused by acquifer-system compaction in the Paso Robles area, S. Louis Obispo County, California, March to August 1997” (USGS Open File Rept., 00-447). 20. E. J. Fielding, R. G. Bloom, R. M. Goldstain. Geophys. Res. Lett. 25, 3215-3218 (1998). 21. J. L. Brink et al., paper presented at the SPE Annual Technical Conference and Exhibition, S. Antonio, Texas, 29 September-2 October 2002. 1522
