BUILDING RECONSTRUCTION FROM INSAR DATA BY DETAIL ANALYSIS OF PHASE PROFILES
advertisement
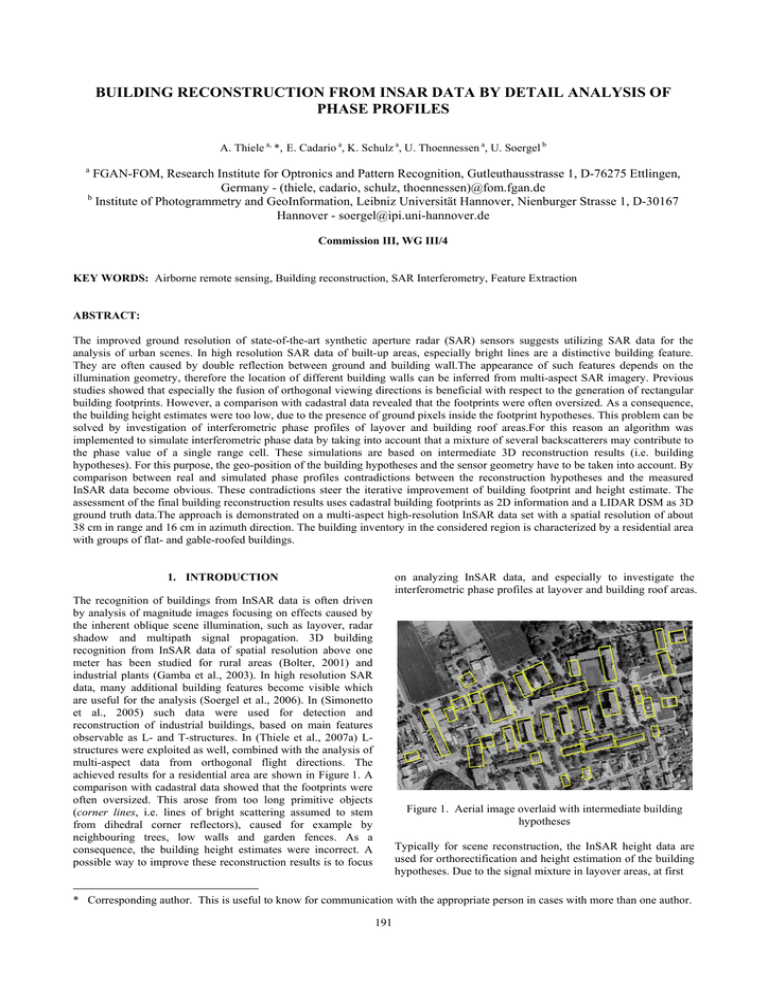
BUILDING RECONSTRUCTION FROM INSAR DATA BY DETAIL ANALYSIS OF PHASE PROFILES A. Thiele a, *, E. Cadario a, K. Schulz a, U. Thoennessen a, U. Soergel b a FGAN-FOM, Research Institute for Optronics and Pattern Recognition, Gutleuthausstrasse 1, D-76275 Ettlingen, Germany - (thiele, cadario, schulz, thoennessen)@fom.fgan.de b Institute of Photogrammetry and GeoInformation, Leibniz Universität Hannover, Nienburger Strasse 1, D-30167 Hannover - soergel@ipi.uni-hannover.de Commission III, WG III/4 KEY WORDS: Airborne remote sensing, Building reconstruction, SAR Interferometry, Feature Extraction ABSTRACT: The improved ground resolution of state-of-the-art synthetic aperture radar (SAR) sensors suggests utilizing SAR data for the analysis of urban scenes. In high resolution SAR data of built-up areas, especially bright lines are a distinctive building feature. They are often caused by double reflection between ground and building wall.The appearance of such features depends on the illumination geometry, therefore the location of different building walls can be inferred from multi-aspect SAR imagery. Previous studies showed that especially the fusion of orthogonal viewing directions is beneficial with respect to the generation of rectangular building footprints. However, a comparison with cadastral data revealed that the footprints were often oversized. As a consequence, the building height estimates were too low, due to the presence of ground pixels inside the footprint hypotheses. This problem can be solved by investigation of interferometric phase profiles of layover and building roof areas.For this reason an algorithm was implemented to simulate interferometric phase data by taking into account that a mixture of several backscatterers may contribute to the phase value of a single range cell. These simulations are based on intermediate 3D reconstruction results (i.e. building hypotheses). For this purpose, the geo-position of the building hypotheses and the sensor geometry have to be taken into account. By comparison between real and simulated phase profiles contradictions between the reconstruction hypotheses and the measured InSAR data become obvious. These contradictions steer the iterative improvement of building footprint and height estimate. The assessment of the final building reconstruction results uses cadastral building footprints as 2D information and a LIDAR DSM as 3D ground truth data.The approach is demonstrated on a multi-aspect high-resolution InSAR data set with a spatial resolution of about 38 cm in range and 16 cm in azimuth direction. The building inventory in the considered region is characterized by a residential area with groups of flat- and gable-roofed buildings. on analyzing InSAR data, and especially to investigate the interferometric phase profiles at layover and building roof areas. 1. INTRODUCTION The recognition of buildings from InSAR data is often driven by analysis of magnitude images focusing on effects caused by the inherent oblique scene illumination, such as layover, radar shadow and multipath signal propagation. 3D building recognition from InSAR data of spatial resolution above one meter has been studied for rural areas (Bolter, 2001) and industrial plants (Gamba et al., 2003). In high resolution SAR data, many additional building features become visible which are useful for the analysis (Soergel et al., 2006). In (Simonetto et al., 2005) such data were used for detection and reconstruction of industrial buildings, based on main features observable as L- and T-structures. In (Thiele et al., 2007a) Lstructures were exploited as well, combined with the analysis of multi-aspect data from orthogonal flight directions. The achieved results for a residential area are shown in Figure 1. A comparison with cadastral data showed that the footprints were often oversized. This arose from too long primitive objects (corner lines, i.e. lines of bright scattering assumed to stem from dihedral corner reflectors), caused for example by neighbouring trees, low walls and garden fences. As a consequence, the building height estimates were incorrect. A possible way to improve these reconstruction results is to focus Figure 1. Aerial image overlaid with intermediate building hypotheses Typically for scene reconstruction, the InSAR height data are used for orthorectification and height estimation of the building hypotheses. Due to the signal mixture in layover areas, at first * Corresponding author. This is useful to know for communication with the appropriate person in cases with more than one author. 191 The International Archives of the Photogrammetry, Remote Sensing and Spatial Information Sciences. Vol. XXXVII. Part B3a. Beijing 2008 slant range P art I P art III SLC data preprocessing coregistration magnitude images interferogram calculation line segmentation flat earth correction phase centering extraction of phases calculation of height update of building line filtering of primitives projection assessment of phases P art II multi-aspect primitives (dx) simulation of phase profiles back projection fusion of primitives assembly of hypotheses discrimination of hypotheses fitting of right angled footprint update of building footprint building footprints building footprints calculation of building height calculation of building height 3D building models final 3D building models ground range Figure 2. Workflow diagram for reconstruction of buildings including hypotheses updating, based on simulation of InSAR phase profiles. glance the related InSAR elevation data often seem to consist of arbitrary height values between ground and rooftop levels. Because of this fact, layover areas are often excluded from further recognition steps. In previous research work conspicuous InSAR phase profiles were observed at many building locations. Because of the systematic appearance of such patterns they could be exploited in the process of building recognition and reconstruction. (Thiele et al., 2007a) with the phase simulation approach to improve building reconstruction results. The analysis of InSAR phases in (Burkhart et al., 1996) was motivated by the task of building and tree extraction. The special appearance of the layover area in InSAR phase data at buildings was referred to as the “front porch effect”. (Bickel et al., 1997) also investigated mapping of building structures into InSAR height and coherence data, and presented ideas to identify and mitigate the layover problem. The studies of (Cellier et al., 2006) are focused on segmentation of the borderline of the layover area as seen from the sensor, in order to determine the height of the building. The in (Thiele et al., 2007b) presented mixture model allows to simulate the interferometric phases by taking into account that a mixture of 2. ALGORITHM In the first part of the paper the extended algorithm of assembly and update of building hypotheses is described. Afterwards, the experiments and results are presented. The conclusion and future work points are discussed in the third part. The described methodology aims at building reconstruction from multi-aspect InSAR data. This includes an iterative improvement of the footprint and height estimates. The approach, illustrated in Figure 2, can be split up in to three main parts. The first one comprises the assembly of the first building hypotheses (Thiele et al., 2007a), including the processing steps, which are passed for every aspect direction in slant geometry, and the common generation of hypotheses in ground geometry. The second part, the simulation of interferometric phase data (Thiele et al., 2007b), is based on hypotheses derived in Part I and the sensor geometry. The output phase profiles are given in slant geometry to enable the assessment with the real measured interferometric phases. By varying the front line position, differences between reality and simulations are minimized. This several contributions defines the phases of a single range cell. Hence, it is worthwhile to combine the structural approach 192 The International Archives of the Photogrammetry, Remote Sensing and Spatial Information Sciences. Vol. XXXVII. Part B3a. Beijing 2008 third part of the process includes also the update of the resulting 3D building models. 2.2 Simulation of InSAR Phases (Part II) The process of phase profile simulation (Thiele et al., 2007b) is based on the assembled building hypotheses and the extracted mean building height from the interferometic height data. 2.1 Assembly of Building Hypotheses (Part I) From the given 3D building models in ground geometry, range profiles of phase data are derived. In the case of parallel orientation of azimuth direction and building wall, only one ground range profile is necessary, as shown in Figure 5, first example. layover area building area 3 90 2 Azimuth-Range [pixel] Range direction range 1 60 0 Phase-Value range The processing of the approach starts with the formation of the interferometric height and the magnitude images using the complex data. This comprises a subpixel registration of the images based on coherence maximization. The steps of interferogram generation are given in Figure 2. The subsequent segmentation of primitives is based on the magnitude images. For this the line detector (Tupin et al., 1998) and the StegerOperator (Steger, 1998) are used, followed by a linear approximation and a prolongation step, to result in straight lines. -1 30 -2 0 -3 0 20 40 60 80 100 120 140 160 Slant-Range [pixel] Building line layover area building area 3 2 1 60 0 Phase-Value Azimuth-Range [pixel] 90 -1 30 -2 0 -3 0 Figure 3. Magnitude images of direction 1 (left) and direction 2 (right) overlaid with detected bright lines of two buildings under investigation 20 40 60 80 100 120 140 160 Slant-Range [pixel] Figure 5. Range profile direction of different building orientations (left); corresponding simulation results of phase profiles (right) In Figure 3 the detected primitives of two selected buildings illuminated from orthogonal flight directions are shown. These lines are projected into the ground geometry by using the interferometric height data. Finally, the primitives of all flight directions are mapped into a common world coordinate system (Figure 4 (left)) and fused to building hypotheses by a rulebased production system. A non-parallel configuration results in a continuous change of the simulated ground range profile and the building length, respectively (Figure 5, second example). The actual implementation of the simulation workflow comprises a shifting of the range lines, leading to a corner line orientation (red marked dotted line) parallel to the y-axis (Figure 5 (right)). In a first step, L-structures are assembled from pairs of lines, which meet certain criteria: angle close to 90 degrees (i.e. building footprints are modelled to be rectangular), bridging and gap tolerances, and orientation of the corner towards the sensor. The ground range profiles are split up into connected linear components of constant gradient. For each range cell, from these segments certain features are calculated, such as normal vector, local incidence angle, range distance differences and phase difference. The subsequent simulation is carried out according to the slant range grid of the final interferogram. For assessment between simulated and real measured phases, the different azimuth and range resolution of the investigated InSAR data have to be considered. The resulting interferometric phase of one range cell is calculated by summing up all contributions (e.g. from ground, wall and roof). Furthermore, the process of phase profile simulation includes detection of shadow areas and flat earth correction. The shadow areas are modelled to coincide with areas of zero reflection; noise impact is not considered here. The simulation results for a parallel and non-parallel orientation, respectively, are given in Figure 5 (right). Figure 4. LIDAR-DSM overlaid with projected corner lines (left) of orthogonal flight directions and rectangular building hypotheses (right) 2.3 Assessment between Simulated and Real InSAR Phase (Part III) From the set of L-structures parallelograms are built, which are fit to right angled footprints. The intermediate footprints of the building hypotheses are shown in Figure 4 (right). The assessment between the simulated and the real measured interferometric phases requires the registration of both datasets. In the first step based on the extracted building footprint the 193 The International Archives of the Photogrammetry, Remote Sensing and Spatial Information Sciences. Vol. XXXVII. Part B3a. Beijing 2008 between both phase areas are visualised in Figure 6 (d). In the above-mentioned case of too large building footprints, the simulated and the extracted real phases show large differences. This geometric situation is illustrated in Figure 7. The shaded area of the building hypothesis (Figure 7 (a)) is equal to the simulated phase area of Figure 6 (a). As a consequence of the wrong position of the building line hypothesis only a small area of the extracted real phase corresponds with the true building location (Figure 6 (b), Figure 7 (b)). simulated phases are calculated so that the orientation of the footprint line is parallel to the y-axis (Figure 6 (a)). In the next step the related image area in the real InSAR data is derived. The length of the considered range lines is taken from the simulation results. The number of range lines (width of phase area) is calculated from the length and orientation of the line of building footprint facing towards the sensor. In a subsequent step, the extracted range area will be geometrically corrected to show the same orientation as the simulated phases. An example is given in Figure 6 (b). layover area To improve this, the correction of the building line is necessary. The updating of the building line is implemented by a parallel shift along the second building line (Figure 7 (c), blue) in discrete steps. On every position the correlation coefficient between simulated and real InSAR phases is calculated. The final position of the building line is then given by the maximum of the calculated coefficients. building area 3 2 1 75 0 50 Phase-Value Azimuth-Range [pixel] 100 -1 25 -2 0 The real phase area for the correlation maximum as well as the differences between the phases are given in Figure 6 (c),(e). -3 0 20 40 a 60 80 100 120 140 160 Slant-Range [pixel] 3 100 The improvement of the building hypotheses comprises a correction in slant range (parameter sr and sa) and ground range geometry. The ground range shift is calculated considering the viewing direction, local incidence angle at this geo-position and range resolution. Based on the new building footprints, the building heights are recalculated. 1 50 0 25 Phase-Value Azimuth-Range [pixel] 2 75 -1 -2 0 -3 0 20 40 b 60 80 100 120 140 160 Building hypothesis Slant-Range [pixel] 3 100 Building line 1 50 0 Phase-Value Azimuth-Range [pixel] 2 75 -1 25 -2 0 -3 0 20 40 c 60 80 100 120 140 160 Slant-Range [pixel] Real building a 3 100 1 0 50 Phase-Value Azimuth-Range [pixel] 2 75 -1 25 -2 0 -3 0 20 40 d 60 80 100 120 140 b 160 Slant-Range [pixel] Range direction 3 2 Real building 1 75 0 50 Phase-Value Azimuth-Range [pixel] 100 Updated building line -1 25 -2 0 -3 0 e 20 40 60 80 100 120 140 160 Slant-Range [pixel] Figure 6. Simulation result for a non-parallel building and flight path configuration (a); extracted real InSAR phase without (b) and with update of building line location (c); differences between simulated and real InSAR phases without (d) and with update of building line location (e) c sr sa Range direction Figure 7. Illustration of simulated (a) and extracted real phase area (b) for an oversized building; Illustration of iterative footprint update (c) For assessment of the similarity between the simulated and real phase areas the correlation coefficient is used. The differences 194 The International Archives of the Photogrammetry, Remote Sensing and Spatial Information Sciences. Vol. XXXVII. Part B3a. Beijing 2008 The approach was tested on two residential buildings, which in former studies (Thiele et al., 2007a) showed an oversized footprint. The results of line segmentation on the multi-aspect data are given in Figure 3. The corresponding assembled building hypotheses are depicted in Figure 4 (right). In Figure 6 (Building 1) and Figure 8 (Building 2), the subsequent simulation results of the phases as well as the extracted real phases are plotted. 3. EXPERIMENTS The investigated real InSAR data set was recorded by the AeS1 sensor system of Intermap Technologies (X-Band) (Schwaebisch et al., 1999). The spatial resolution is about 38 cm in range and 16 cm in azimuth direction, off-nadir angle variation is from 28° (close range) up to 52° (far range), and the effective baseline is 2.4 m. The test area was mapped from two different aspects spanning an angle of approximately 90°. The investigated region is characterized by a residential area. In Figure 3 a part of the magnitude images of both illumination directions is shown. layover area The extraction of the correlation maximum resulted in a translation of 26 pixels for Building 1. This is much more than the translation for Building 2 with a shifting of 9 pixels. The shift in slant range geometry is visualized in Figure 9 (left) as a yellow line. The correction in ground range geometry is 13.78 m for Building 1 and 4.77 m for Building 2. The overlay with the LIDAR-DSM shows further improvement possibilities of the building footprint. The verification of such possibilities is part of future work. building area 3 2 1 60 0 Phase-Value Azimuth-Range [pixel] 90 -1 30 -2 0 -3 0 20 40 a 60 80 100 120 140 160 Slant-Range [pixel] 3 90 1 60 0 30 Phase-Value Azimuth-Range [pixel] 2 -1 -2 0 -3 0 20 40 b 60 80 100 120 140 160 Slant-Range [pixel] Figure 9. Real InSAR phases (left) overlaid with footprint lines (red, blue) and corrected line (yellow); LIDAR-DSM overlaid with building hypotheses (right; yellow – old; red – update) 3 90 1 0 30 Phase-Value Azimuth-Range [pixel] 2 60 4. RESULTS -1 -2 The approach was applied to two buildings (Figure 9) located in a residential area of Dorsten (Germany). The visual comparison of the final footprints with the LIDAR-DSM data shows good matching. The geometric building parameters are listed in Table 1. From the cadastral data the length and the width of the buildings are extracted. The measured ground truth height is based on the LIDAR mean height inside the building footprint. 0 -3 0 20 40 c 60 80 100 120 140 160 Slant-Range [pixel] 3 90 1 0 30 Phase-Value Azimuth-Range [pixel] 2 60 -1 Building Parameter -2 0 -3 0 20 40 d 60 80 100 120 140 160 Slant-Range [pixel] 3 90 Building 1 Building 2 Ground truth Length Width Height 36.0 m 11.5 m 12.8 m 36.0 m 11.5 m 10.0 m Hypotheses Length Width Height (Std.) 50.7 m 17.6 m 9.8 m (4.0 m) 48.9 m 15.7 m 10.5 m (2.9 m) Updated Hypotheses Length Width Height (Std.) 36.9 m 17.6 m 11.4 m (3.3 m) 44.1 m 15.7 m 10.9 m (2.5 m) 1 0 30 Phase-Value Azimuth-Range [pixel] 2 60 -1 -2 0 -3 0 e 20 40 60 80 100 120 140 160 Slant-Range [pixel] Figure 8. Simulation result of a non-parallel building (a); extracted real InSAR phases without (b) and with update of building line location (c); differences between simulated and real InSAR phases without (d) and with update of building line location (e) Table 1. Ground truth data and results of building reconstruction The reconstruction results of the buildings before and after the 195 The International Archives of the Photogrammetry, Remote Sensing and Spatial Information Sciences. Vol. XXXVII. Part B3a. Beijing 2008 Bolter, R. 2001. Buildings from SAR: Detection and Reconstruction of Buildings from Multiple View High Resolution Interferometric SAR Data. Ph.D. dissertation, University Graz. updating steps are given. The comparison shows a significant improvement of the footprint and the building height for Building 1. For Building 2 the improvement was smaller, because the second footprint line (Figure 7 (c), blue) is oversized in both directions. Burkhart, G.R., Bergen, Z., Carande, R. 1996. Elevation Correction and Building Extraction from Interferometric SAR Imagery. In: Proceedings of IGARSS, Vol. 1, 27-31 May, Lincoln, Nebraska, USA, pp. 659-661. To conclude, the above mentioned problem of oversized footprints and the accordingly underestimated building height was successfully mitigated by the implemented update step, but additional update steps considering the whole footprint are necessary and planned for the future. Cellier, F., Oriot, H., Nicolas, J.-M. 2006. Study of altimetric mixtures in layover areas on high-resolution InSAR images. In: Proceedings of EUSAR, Dresden, Germany, CD ROM. 5. CONCLUSION Gamba, P., Dell’Acqua, F., Houshmand, B. 2003. Comparison and fusion of LIDAR and InSAR digital elevation models over urban areas. In: International Journal Remote Sensing, Vol. 24, No. 22, 20 November, pp. 4289-4300. In this paper an approach was presented to reconstruct buildings, especially smaller buildings, from multi-aspect high resolution InSAR data. The first part of the algorithm comprises the assembly of the building hypotheses. For this purpose, bright lines of scattering are detected and fused to L-structures. The generated building footprints as well as the calculated building height are input parameters of the subsequent phase simulation. This second part of the algorithm calculates phase profiles in range direction by taking into account that several scattering processes can contribute to the interferometric phase of a single range cell. From the real InSAR data the phases corresponding to the footprint are extracted for assessment with the simulated ones. The correlation coefficient is used as decision criterion for the hypothesis update. Schwaebisch, M., Moreira, J. 1999. The high resolution airborne interferometric SAR AeS-1. In: Proceedings of the Fourth International Air-borne Remote Sensing Conference and Exhibition, Ottawa, Canada, pp. 540-547. Simonetto, E., Oriot, H., Garello, R. 2005. Rectangular building extraction from stereoscopic airborne radar images. IEEE Transactions on Geoscience and Remote Sensing, Vol. 43, No. 10, pp. 2386-2395. The approach was tested on an area in which the effect of oversized building footprints was observable in previous studies. The validation of the results was focused on two buildings. Comparison between final and original building hypothesis showed a high improvement of the reconstruction results. Soergel, U., Thoennessen, U., Brenner, A., Stilla, U. 2006. High resolution SAR data: new opportunities and challenges for the analysis of urban areas. IEE Proceedings - Radar, Sonar, Navigation. Steger, C. 1998. An Unbiased Detector of Curvilinear Structures. IEEE Transactions on Pattern Analysis and Machine Intelligence Vol. 20, No. 2, pp. 113-125. Thiele, A., Cadario, E., Schulz, K., Thoennessen, U., Soergel, U. 2007a. Building recognition from multi-aspect high resolution InSAR data in urban area. IEEE Transactions on Geoscience and Remote Sensing, Vol. 45, No. 11, pp. 3583-3593. The implementation of further update steps of the building hypotheses is planned for the future. Both increasing and decreasing of the footprint should be possible. Furthermore, a repetition of the simulation and assessment steps between the phases has to be realised. Considering multi-aspect data allows a complementary and redundant application of the hypothesis updating steps. Thiele, A., Cadario, E., Schulz, K., Thoennessen, U., Soergel, U. 2007b. InSAR Phase Profiles at Building Locations. Proceeding of ISPRS Photogrammetric Image Analysis, Vol. XXXVI, Part 3/W49A, pp. 203-208. REFERENCES Tupin, F., Maitre, H., Mangin, J.-F., Nicolas, J.-M., Pechersky, E. 1998. Detection of Linear Features in SAR Images: Application to Road Network Extraction. IEEE Transactions on Geoscience and Remote Sensing, Vol. 36, No. 2, pp. 434-453. Bickel, D.L., Hensley W.H., Yocky, D.A. 1997. The Effect of Scattering from Buildings on Interferometric SAR Measurements. In: Proceedings of IGARSS, Vol. 4, 3-8 August, Singapore, pp. 1545-1547. 196
