QUALITY CONTROL METHOD FOR FILTERING IN AERIAL LIDAR SURVEY

QUALITY CONTROL METHOD FOR FILTERING IN AERIAL LIDAR SURVEY
Y. Yokoo a,
a , a
Kokusai Kogyo CO., LTD. ,Base Information Group,
2-24-1 Harumicho Fuchu-shi, Tokyo, 183-0057, JAPAN - (yasuhiro_yokoo, tetsu_ooishi)@kkc.co.jp
Commission WG I/2
KEY WORDS: LIDAR, Filtering, QC/QA map, Shaded Relief, Ground Point Data, Original Point Data ,
ABSTRACT:
The purpose of filtering LIDAR data is to extract the laser points which are truly reflected from the bare ground. However, the results obtained may vary since several engineers are involved in the manual filtering process. For this reason, the QC/QA maps are created in Japan after the filtering process in order to control the filtering quality. This paper describes a quality control method using an original and a unique QC/QA maps. We use two types of QC/QA maps to check the filtering results: one is a color-shaded relief map and the other is our monochrome-shaded point maps. The reason we use two types of QC/QA maps is that they have different purposes. The purpose of color-shaded relief map is used to inspect the detailed noise data. In contrast, the purpose of a monochrome-shaded point map is to examine the over-elimination of point clouds during the filtering process. Using these two types of maps together, we are able to extract from the point clouds obtained by airborne LIDAR that are truly reflected from the bare ground. Finally, we have carried out image analysis of monochrome-shaded point maps to automatically extract the erroneouslyeliminated points from the point clouds. Some results of automatic extraction are also reported. This quality control method will certainly improve the quality of the filtering process for the airborne LIDAR points. The method described can be applied not only to airborne LIDAR but also to terrestrial laser surveys. However, more study on the automatic examination is needed in the future, and some considerations regarding to the automatic examination are also described in this paper.
1.
INTRODUCTION
An airborne LIDAR system makes it possible for the speedy acquisition of high-density/high-accuracy three-dimensional
(3D) topographic data at low cost. These 3D topographic data have become available for various purposes including flood control and environmental protection measurements.
Among their applications is the hydraulic analysis of rivers to evaluate the safety level of flood control measurements. As the results of this analysis affect human lives and properties, it is extremely important that the presentation of topography provided by the 3D topographic data be accurate.
So far, attention has been paid to the elimination of 3D data from feature data such as trees and structures in the process of
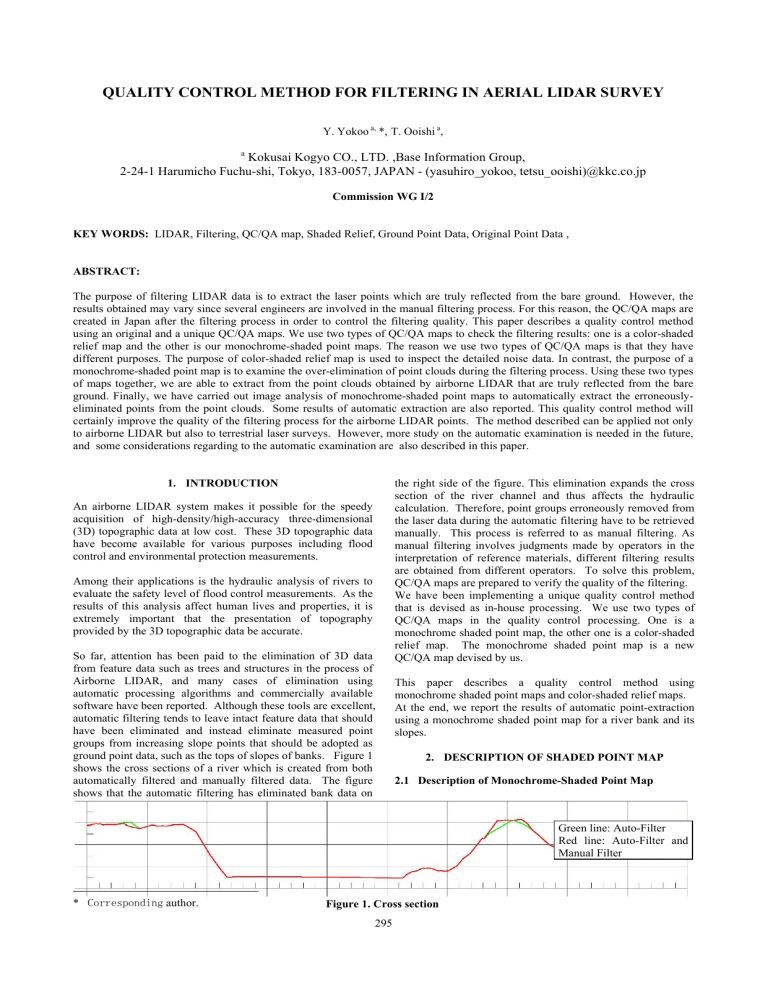
Airborne LIDAR, and many cases of elimination using automatic processing algorithms and commercially available software have been reported. Although these tools are excellent, the right side of the figure. This elimination expands the cross section of the river channel and thus affects the hydraulic calculation. Therefore, point groups erroneously removed from the laser data during the automatic filtering have to be retrieved manually. This process is referred to as manual filtering. As manual filtering involves judgments made by operators in the interpretation of reference materials, different filtering results are obtained from different operators. To solve this problem,
QC/QA maps are prepared to verify the quality of the filtering.
We have been implementing a unique quality control method that is devised as in-house processing. We use two types of
QC/QA maps in the quality control processing. One is a monochrome shaded point map, the other one is a color-shaded relief map. The monochrome shaded point map is a new
QC/QA map devised by us.
This paper describes a quality control method using monochrome shaded point maps and color-shaded relief maps.
At the end, we report the results of automatic point-extraction automatic filtering tends to leave intact feature data that should have been eliminated and instead eliminate measured point groups from increasing slope points that should be adopted as ground point data, such as the tops of slopes of banks. Figure 1 using a monochrome shaded point map for a river bank and its slopes.
2.
DESCRIPTION OF SHADED POINT MAP shows the cross sections of a river which is created from both automatically filtered and manually filtered data. The figure shows that the automatic filtering has eliminated bank data on
2.1
Description of Monochrome-Shaded Point Map
Green line: Auto-Filter
Red line: Auto-Filter and
Manual Filter
* Corresponding author. Figure 1. Cross section
295
The International Archives of the Photogrammetry, Remote Sensing and Spatial Information Sciences. Vol. XXXVII. Part B1. Beijing 2008
A monochrome shaded point map is a map that the ground points extracted from the filtering process are overlaid on a shaded map created from DSM data. Figure 2 shows a monochrome shaded point map. The ground data to be used are shown in small red points. The places in dark red area in the map are the places where the measurement data coincide and thus have high point density. The shaded map is presented in monochrome depends on the amount of shadow. And the ground points are presented in the plainly different color from the monochrome shaded map. The following are the advantages of using a monochrome shaded map as the background:
2.1.1
Easy Viewing of Ground Objects : the shaded map does not interfere with the display of the point clouds that are targeted for examination. It allows interpretation of topography and features.
2.1.2
Data Created from Measurement Data : As it is created from measured data, it is possible to determine whether measurements have actually been taken or not.
2.1.3
No Distortion and Halation : there is no distortion or halation of the buildings that is quite different from the aerial photograph. Because the monochrome shaded point map is generated only from the Lidar point clouds.
2.1.4
No Special Equipment for 3D-Recognition : It allows
3D-recognition without special equipment or spectacles. such cases the quality control of the maps may not be satisfactory. To solve this problem, we developed a new quality control method using both monochrome shaded point maps and color-shaded maps. Figure 4 shows the workflow of the new QC/QA method.
Original Point Data
Creation of a monochrome shaded map
Figure 3. Monochrome Shaded Point Map of a Forested
Area
Ground Point Data
Creation of a monochrome shaded point map
Creation of a color- shaded map
Figure 2 Monochrome Shaded Point Map
2.2
Disadvantages of a monochrome shaded point map
While the legibility of point clouds after filtering is high, one disadvantage of a monochrome shaded point map is that it cannot be used alone. Figure 3 shows a monochrome shaded point map in a forested area. It is impossible to interpret whether point clouds displayed on the map represent ground point data or feature data derived from the measurement of the tops of trees. Comparison with another QC/QA map is required to verify whether the feature data of the forest remain on the map or not.
3.
DESCRIPTION OF QUALITY CONTROL METHOD
3.1
Outline and Features of Quality Control Method
As mentioned above, in some cases, the interpretation of monochrome shaded point maps can be problematic, and in
296
Examination of the monochrome shaded point map
Examination of the color- shaded map
Figure 4. Workflow of the Quality Control Method
3.2
Examination of the Color-Shaded Map
It is known that a color-shaded map allows the presentation of micro topology. The filtering results that are examined using this QC/QA map are shown in Figure 5. The reasons for choosing the color-shaded map are as follows:
・ A color-shaded map is suitable for detailed examination of forests, which cannot be examined with a monochrome shaded point map.
・
It can be created automatically and is suitable for processing a large amount of data.
・ Feature data remained after filtering have an elevation different from the surrounding topography, and this difference creates a shadow on the color-shaded map. This shadow serves as a reference and provides a clear basis for decision-making in the examination of the filtering
( shown in Figure 6 ) .
・ It enables examination of detailed and fine feature data.
The International Archives of the Photogrammetry, Remote Sensing and Spatial Information Sciences. Vol. XXXVII. Part B1. Beijing 2008
River
Forest
Road
Bridge
3.3
Figure 5. A color-shaded map
Figure 6. Remaining tree data
Examination of Monochrome Shaded Point Map
Road of points
Figure (b)) shows that ground data has been eliminated. From the result of the examination of the monochrome shaded point map, it can be concluded that “the filtering has been excessive and, thus, the point groups have to be retrieved using manual filtering.”
Bank
Figure 7. Examination Result
Figure 8 shows QC/QA maps of a forested area. As the monochrome shaded point map cannot be used to examine a forested area, as mentioned above, the color-shaded map is used.
Figure 9 shows QC/QA maps of an area with a bridge. DEM used in a color-shaded map is created from ground data as TIN.
As shown in Figure 9(b), though the data have actually been eliminated, as they form TIN with data on the other side of the river, the bridge appears to remain on the map. A monochrome shaded point map is effective for the examination of a bridge over a narrow river.
Figure 10 shows QC/QA maps of a site at which points on river banks have been excessively filtered. The color-shaded map
(Figure 10(a)) allows interpretation of the shape of the banks, so it has to be concluded that there has been no problem in the filtering. Meanwhile, the accentuated display of the monochrome shaded map on the background of the
A monochrome shaded point map is primarily used to examine the state of the filtering of bare land. Figure 7 shows a monochrome shaded point map of an area along a river. When we focus on the bridge in Figure 7, the accentuated display of the monochrome shaded map against the background confirms that the filtering has been implemented accurately. When we focus on the bank, elimination of the ground data is observed at the places indicated by arrows. A similar elimination of the ground data is also observed on the top of the slope of the road.
As the topography is represented by the shaded map in the background, it can be concluded that at these places the ground data have been measured and then erroneously eliminated during the filtering.
As mentioned above, the use of a monochrome shaded point map is an effective method of detecting point clouds erroneously eliminated during the filtering process.
3.4
Combined Use of QC/QA Maps and Its Effect
(a) Color-shaded map (b) Monochrome shaded point map
Figure 8. Examination of a forested area
A monochrome shaded point map cannot be used for the examination of feature data in a forested area. At the same time, a color-shaded map cannot detect the elimination of data during excessive filtering. Therefore, we have developed a quality control method that uses a combination of the monochrome shaded point map and the color-shaded map. The purpose of this combined use is to compensate for the disadvantages of one with the other.
(a) Color-shaded map (b) Monochrome shaded point map
297
The International Archives of the Photogrammetry, Remote Sensing and Spatial Information Sciences. Vol. XXXVII. Part B1. Beijing 2008
Figure 9. Examination of an area with a bridge
Monochrome shaded point map
Calculation of the density of point groups
Ground data
Calculation of the standard deviation of elevation
Extraction of areas of low density
Extraction of areas of small standard deviation
(a) Color-shaded map (b) Monochrome shaded point map
Figure 10. Examination of an area with banks
The above example proves the effectiveness of the method of using a monochrome shaded point map and a color-shaded map to examine the filtering when extracting ground data from obtained laser data.
Table 1 summarizes the details of the examination.
Monochrome shaded point map
Color-shaded map
Items of examination
Examination of the filtering of buildings/structure s
Can be examined Can be examined
Examination of the filtering of forested areas
Cannot be examined
Can be examined
Examination of the filtering of bridges
Can be examined
A bridge over a narrow river cannot be examined
Examination of excessive filtering at points of increasing slope.
Can be examined
Cannot be examined
Table 1. Summary of the details of the examination
4.
AUTOMATIC EXTRACTION OF DEFECTS IN A
MONOCHROME-SHADED POINT MAP
Extraction of areas of low density and small standard deviation
Creation of missing polygons
Figure 11. Workflow
4.2
Results of Automatic Extraction
Figure 12 shows the results of automatic extraction. In order to interpret the extraction results, the orthophotos is displayed as the background. The points shown on the map indicate the places where the points are over-extracted in the automatic filtering process. At the points on the slope where the slope degree changed greatly, such as the corners of large banks, generally satisfactory results were obtained from the automatic extraction. However, some areas including those along the river were erroneously extracted because the standard deviation calculated from the value of elevation was used as the indicator.
On the other hand, small banks failed to be extracted automatically because of their small standard deviation and their low ground data density.
Using a monochrome shaded point map, the automatic extraction of defects at the points of slope angle changing on banks is examined. Figure 11 shows the workflow for this examination.
4.1
Outline of Automatic Extraction
Figure 12. Result of the Image Analysis
Use of a monochrome shaded point map alone, which simply selects the areas of low group point density, results in the inclusion of the areas eliminated by the filtering because of dense vegetation and areas of water. With the aim of excluding these areas, the standard deviation of elevation was calculated from the values of elevation of ground point data, and areas with small standard deviation were extracted as bare land.
5.
CONCLUSIONS
298
Recently, various methods of presenting micro topography, e.g.
ELSAMAP and the Red Relief Image Map, have been reported.
To make good use of these micro topography presentation methods, producers have to ensure sufficient quality control of their products.
The quality control method that combines the use of a monochrome shaded point map and a color-shaded map has
The International Archives of the Photogrammetry, Remote Sensing and Spatial Information Sciences. Vol. XXXVII. Part B1. Beijing 2008 improved filtering accuracy. It is expected that automation of this method will make the examination process more efficient.
Up to now, examination of the filtering has had to be done by an expert as it involves making reference to contour lines and orthophotos. With the new quality control method, a nonexpert will be able to examine the filtering because there are clear criteria for the interpretation of abnormalities in the filtering.
Automation will also lead to the elimination of oversight in the examination process, and thus is expected to improve the efficiency of the work.
As this new quality control method does not require orthophotos, it will have a positive effect on shortening the work period. However, orthophotos are not absolutely unnecessary. A monochrome shaded map has some areas where the topography is unclear, the reference to the orthophotos is necessary when filtering such areas.
A problem remaining to be solved is the need to examine more than one map. The authors have tried the method of presenting a layered display of ground data in black and white on a colorshaded map. However, this method has been abandoned as it was not possible to interpret topography or point clouds on the background. In future, it is hoped that a QC/QA map will be developed on which both the ground data and micro topography can be represented on a single sheet.
REFERENCES
Vu,T.Thuy,2004.Filtering Airborne Laser Scanner Data.
Photogrammetric Engineering and Remote Sensing, 70(11) , pp.
1267-1274.
Sasaki, H., 2007. The Development of ELSAMAP (Elevation and Slope Angle Map) for Geographical Features Interpretation.
APA, 93, pp.8-16.
299
The International Archives of the Photogrammetry, Remote Sensing and Spatial Information Sciences. Vol. XXXVII. Part B1. Beijing 2008
300


