Document 11833405
advertisement
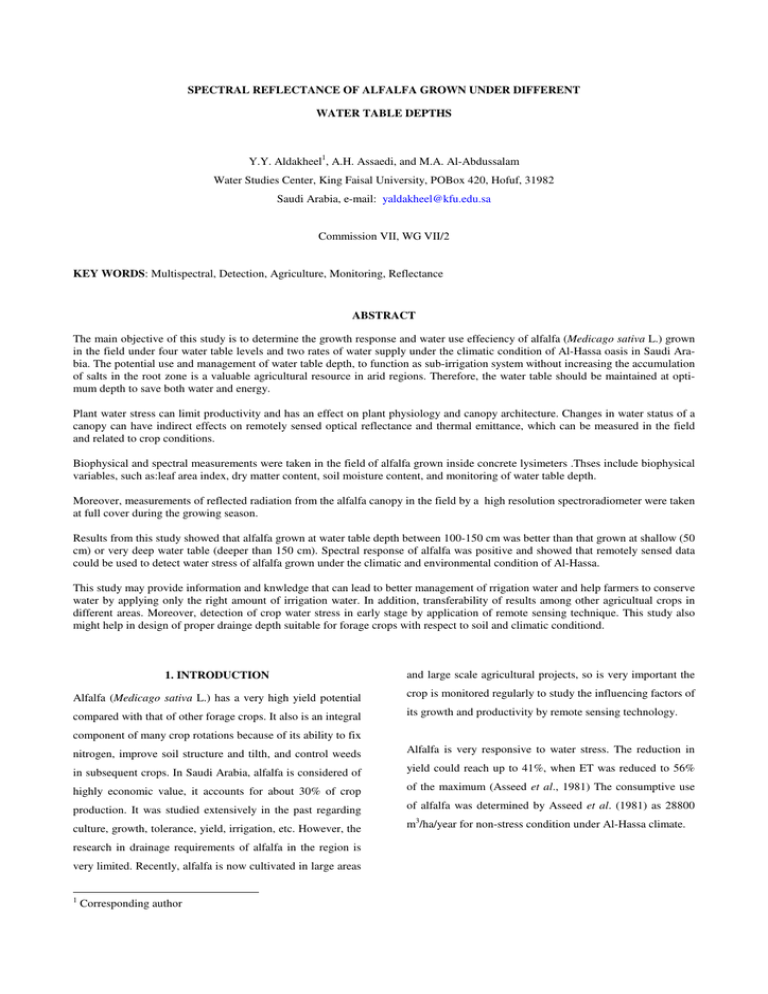
SPECTRAL REFLECTANCE OF ALFALFA GROWN UNDER DIFFERENT WATER TABLE DEPTHS Y.Y. Aldakheel1, A.H. Assaedi, and M.A. Al-Abdussalam Water Studies Center, King Faisal University, POBox 420, Hofuf, 31982 Saudi Arabia, e-mail: yaldakheel@kfu.edu.sa Commission VII, WG VII/2 KEY WORDS: Multispectral, Detection, Agriculture, Monitoring, Reflectance ABSTRACT The main objective of this study is to determine the growth response and water use effeciency of alfalfa (Medicago sativa L.) grown in the field under four water table levels and two rates of water supply under the climatic condition of Al-Hassa oasis in Saudi Arabia. The potential use and management of water table depth, to function as sub-irrigation system without increasing the accumulation of salts in the root zone is a valuable agricultural resource in arid regions. Therefore, the water table should be maintained at optimum depth to save both water and energy. Plant water stress can limit productivity and has an effect on plant physiology and canopy architecture. Changes in water status of a canopy can have indirect effects on remotely sensed optical reflectance and thermal emittance, which can be measured in the field and related to crop conditions. Biophysical and spectral measurements were taken in the field of alfalfa grown inside concrete lysimeters .Thses include biophysical variables, such as:leaf area index, dry matter content, soil moisture content, and monitoring of water table depth. Moreover, measurements of reflected radiation from the alfalfa canopy in the field by a high resolution spectroradiometer were taken at full cover during the growing season. Results from this study showed that alfalfa grown at water table depth between 100-150 cm was better than that grown at shallow (50 cm) or very deep water table (deeper than 150 cm). Spectral response of alfalfa was positive and showed that remotely sensed data could be used to detect water stress of alfalfa grown under the climatic and environmental condition of Al-Hassa. This study may provide information and knwledge that can lead to better management of rrigation water and help farmers to conserve water by applying only the right amount of irrigation water. In addition, transferability of results among other agricultual crops in different areas. Moreover, detection of crop water stress in early stage by application of remote sensing technique. This study also might help in design of proper drainge depth suitable for forage crops with respect to soil and climatic conditiond. 1. INTRODUCTION and large scale agricultural projects, so is very important the Alfalfa (Medicago sativa L.) has a very high yield potential crop is monitored regularly to study the influencing factors of compared with that of other forage crops. It also is an integral its growth and productivity by remote sensing technology. component of many crop rotations because of its ability to fix nitrogen, improve soil structure and tilth, and control weeds Alfalfa is very responsive to water stress. The reduction in in subsequent crops. In Saudi Arabia, alfalfa is considered of yield could reach up to 41%, when ET was reduced to 56% highly economic value, it accounts for about 30% of crop of the maximum (Asseed et al., 1981) The consumptive use production. It was studied extensively in the past regarding of alfalfa was determined by Asseed et al. (1981) as 28800 culture, growth, tolerance, yield, irrigation, etc. However, the m3/ha/year for non-stress condition under Al-Hassa climate. research in drainage requirements of alfalfa in the region is very limited. Recently, alfalfa is now cultivated in large areas 1 Corresponding author The potential of using drainage systems, i.e. the management In recent studies, the soil adjusted vegetation index (SAVI) of water table depth, to function as sub-irrigation system has been used in the combination of spectral and thermal without increasing the accumulation of salts in the root zone bands (Choudhury, 1994 and Moran et al., 1994). The SAVI and is a valuable agricultural resource in arid regions (Benz has the advantage of being more sensitive to the increase in et al., 1984). vegetation cover and less sensitive to spectral changes in the soil background than the NDVI (Huete, 1988). Moran et al. Plant water stress can limit productivity in both natural and (1994) agronomic plant communities. Short term as well as long index/temperature trapezoid (VIT) in an attempt to combine term water stress has the same effects on plant physiology spectral vegetation index with composite surface temperature. and canopy architecture. Changes in water status of a canopy Since spectral vegetation indices are non-linearly related to can have indirect effects on remotely sensed optical vegetation cover (Vc) then Vc is substituted in the Y-axis in reflectance and thermal emittance. the trapezoidal relationship between Vc and the temperature proposed the concept of the vegetation difference Surface temperature (Ts) is a major component in the energy (Ts - Ta). balance equation. Several models have been developed to Recent research has examined technologies involving remote evaluate crop water use, water stress, crop yield and soil sensing to quantify water stress. Moran et al. (1989) moisture (Reginato et al., 1976; Idso et al., 1981; Price, investigated the effect of water stress on canopy architecture 1982; Reginato et al., 1985; Jackson et al., 1987). in alfalfa (Medicago sativa L.) and the sequential effect on canopy reflectance. They found water-stressed canopies to Several authors have investigated the combination of the have a lower spectral reflectance in the NIR and red thermal band 6 of Landsat TM with the reflective bands in wavebands when compared with unstressed canopies. A ratio the Red and NIR, band 3 and band 4, respectively. The of the two wavebands was most successful in estimating the relationship between NDVI and Ts is linear with negative onset of stress. Moran et al. (1994) investigated the concept slope (Gurney et al., 1983; Hope, 1986; Moran et al., 1990). of a water deficit index, which is defined as the ratio of actual This relationship could be diagnostic of plant water stress, to potential ET. This index exhibits the ability to predict ET particularly, given rate and relative field water deficit for both full-cover and meteorological condition, the surface of bare soil would tend partially-vegetated sites. The measurement can be calculated to have a stable maximum surface temperature once soil from remotely sensed data (red and NIR) gathered with moisture is depleted. Accordingly, spatial variability in plant ground, available moisture (in the root zone) would not be reflected measurements used in the calculation include net radiation, in the Ts of pixels dominated by bare soil (at small NDVI air vapor pressure deficit, air temperature, and wind speed. at large NDVI values. For a values). Moreover, an increase in vegetation moisture stress will cause the Ts of pixels with large NDVI values to increase. For partially irrigated fields and homogeneous crop cover, the NDVI would be relatively unaffected by soil moisture difference, whereas Ts values would be low over the aircraft, or satellite-based sensors. On-site The results of Shakir and Girmay-Gwahid (1998) showed that in the wave length range of 850 - 1150 nm the stressed plots showed lower reflectance than unstressed plots. However the reflectance of stressed plots was higher above the 1150 nm. This study aims to studiy the effect of varying water table irrigated portion and high over the dry portion (Moran et al., depth alfafa spectral reflectance. And to examine if water 1990). Moreover, this was explained in terms of the increase stress is likely to occure due to the variations of watertable in the latent heat flux (LE) associated with greater amount of levels. transpirationally active vegetation (Hope and McDowell, 1992). Table 1 list and define these vegetation indices. 1.1 2. MATERIALS AND METHODS and zero cm. The canopy reflectance of the non-stressed alfalfa Spectral measurements were the measurements of reflected may be mainly dependent on illumination geometry and canopy radiation from the alfalfa canopy, which was grown inside structure; hence the leaf optical properties were believed to lysimeters, remain unchanged. in the field by a high resolution spectroradiometer, ASD FieldSpec. The wavebands taken ranged from 400 – 2500 nm at a bi-weekly collection of along the growing season.Other biophysical measurements taken include leaf area index, dry matter content, chlorophyll content, , and soil moisture content 0.8 0.6 (%) radiation Reflectance reflected 1 0.4 0.2 0 400 700 The lysimeters drain freely to the atmosphere through pipes 1000 1300 1600 1900 2200 2500 ( ( Wavelength (nm) located at the bottom of the soil mass, ended with control valves. Riser tubes was connected to the outlet pipes after the valves. The length of the risers will correspond to each water Figure 1. Spectral reflectance of alfalfa under 150 cm water table table depth. The experiment was conducted under field condition at the Agriculture and Veterinary Training and Research Station, King Faisal University, Al-Ahsa to determine water stress of alfalfa under different levels of water tables. plot.. The soil textural class is a fine sandy loam. The experimental plot was a concrete-made lysimeters (1.30 m (%) table depths: 150, 100, 50, 0 cm will be occupied the whole Reflectance A split plot design in four replicates will be used. Four water 1 0.8 0.4 0.2 0 400 diameter and 2.2 m deep). The local cultivar “Hassawi” will be planted at seeding rate 60 kg/ha. 0.6 700 The seed will be (Wavelength ( inoculated with appropriate commercial rhizobial inoculant. In each experimental plot a dosage rate of 450Kg P2O5/ha 1000 1300 1600 1900 2200 2500 (nm) Figure 2. Spectral reflectance of alfalfa under 100 cm water table was given in a split application after each cut. Normalized Difference Vegetation Index (NDVI) was computed as: (NIR - R)/(NIR + R) where R = Red, NIR = Near Infrared 1 wavebands in electromagnetic spectrum. Soil Adjusted R+0.5)]1.5. 3. RESULTS Figure 1,2,3, and 4 show spectral reflectance of alfalfa ranged 400-2500 nm for all treatments. As can be seen from these figures that the spectral reflectance ratio of alfalfa has been affected by the level of water table. The highst ratio was experienced for 150cm and 100cm and the lowest for 50cm 0.8 (%) Reflecta Vegetation Index ( SAVI ) computed as: [(NIR - R)/(NIR + 0.6 0.4 0.2 0 400 700 1000 1300 1600 1900 2200 2500 ( Wavelength ( (nm) Figure 4. Spectral reflectance of alfalfa under 50 cm water table Alaska. Proceedings of Fourth International Conference of (%) Reflectance Permafrost, 401-404. 1 Hope, A.S. and McDowell, T.P. 1992. The relationship 0.8 between surface temperature and a spectral vegetation in- 0.6 dex of a tallgrass prairie: effects of burning and other 0.4 landscape controls. International Journal of Remote 0.2 Sensing, 13, 2849-2863. 0 400 Huete, A. (1988) Soil-adjusted vegetation index (SAVI). 700 1000 1300 1600 1900 2200 2500 ( Wavelength Remote Sensing of Environment, 25, 295-309. Idso, S.B., Jackson, R.D., Pinter, P.J., Reginato, R.J. and ( Hatfield, J.L. 1981. Normalizing the stress-degree-day paFigure 3. Spectral reflectance of alfalfa under 100 cm water table rameter for environmental variability. Agricultural Meteorology, 24, 24-55. Jackson, R.D., Moran, M.S., Gay, L.W. and Raymound, L.H. Moreover, NDVI and SAVI was computed for all the 1987. Evaluating evaporation from field crops using airborne treatments (figure 5) was shown that SAVI has the ability to radiometry and ground-based meteorological data. Irrigation demonstrate alfalfa response to vartiation in water table level. Science, 8, 81-90. Moran, M.S., Clarke, T.R., Inoue, Y. and Vidal, A. 1994. Es- SAVI 1 0.9 timating crop water deficit using the relation between sur- 0.8 face-air temperature and spectral vegetation index. Remote 0.7 Sensing of Environment, 49, 246-263. 0.6 NDVI 0.5 SAVI Moran, M.S., Jackson, R.D., Hart, G.F., Slater, P.N., Bartell, 150 cm R.J., Riggar, S., Gellman, D. and Santer, P. 1990. Obtaining 0.4 0 cm 50cm 100 cm Figure 5.NDVI and SAVI of alfalfa grown undervarying surface reflectance factors from atmospheric and view angle water table depths corrected SPOT-1 HRV data. Remote Sensing of Environ- In addition to that, the relationship between canopy surface ment, 32, 203-214. temperature and vegetation indices was studied. Figure 7 Moran, M.S., Pinter, P.J., Clothier, B.E. and Allen, S.G. show the Ts-Ta-SAVI (temperature difference and soil 1989. Effects of water stress on the canopy architecture and spectral indices of irrigated alfalfa. Remote Sensing of Environment, 29, 251-261. SAVI 1 0.8 Price, J.C. 1982. On the use of satellite data to infer surface 0.6 fluxes at meteorological scale. Journal of Applied Meteorol- 0.4 ogy, 21, 1111-1122. 0.2 Reginato, R.J., Idso, S.B., Vedder, J.F., Jackson, R.D., Blanchard, M.B. and Goettelman, R. 1976. Soil water content 0 0 1 2 3 4 5 o Ts-Tc ( C) Figure 6 Temperature diference – SAVI trapezoid of alfalfa adujsted vegetation index. 4. REFERENCES Gurney, R.J., Ormsby, J.B., Hall, D.K. 1983. A comparison of remotely sensed surface temperature and biomass estimates for aiding evapotranspiration determination in central and evaporation determined by thermal parameters obtained from ground-based and remote measurements. Journal of Geophysical Research, 81, 1617-1620. Reginato, R.J., Jackson, R.D. and Pinter, P.J. 1985. Evapotranspiration calculated from remote multi spectral and ground station meteorological data. Remote Sensing of Environment, 18, 73-89. Shakir, S.H. and B. Girmay-Gwahid 1998. Spectral Characterization of Water Stress Impact on Some Agricultural Crops: II. Studies on Alfalfa Spectral reflectance at Blythe, The Authors wish to thank Kung Abdulaziz City for Science Agricultural Extension Services, California, USA and Technology (KACST), Riyadh, for the financial support http://texged.ips4.pvamu.edu/presentations_publications/spai for this study (grant L.G-17-5). Thanks also extended to n.htm ( accessed 27 April 2004). Training and Research Station, King Faisal University, Hofuf, for the facilities provided to this research. 5. ACKNOWLEDGEMENTS
