SOLUTION TO JOINT ENTROPY AND ITS APPLICATIONS IN REMOTE SENSING
advertisement
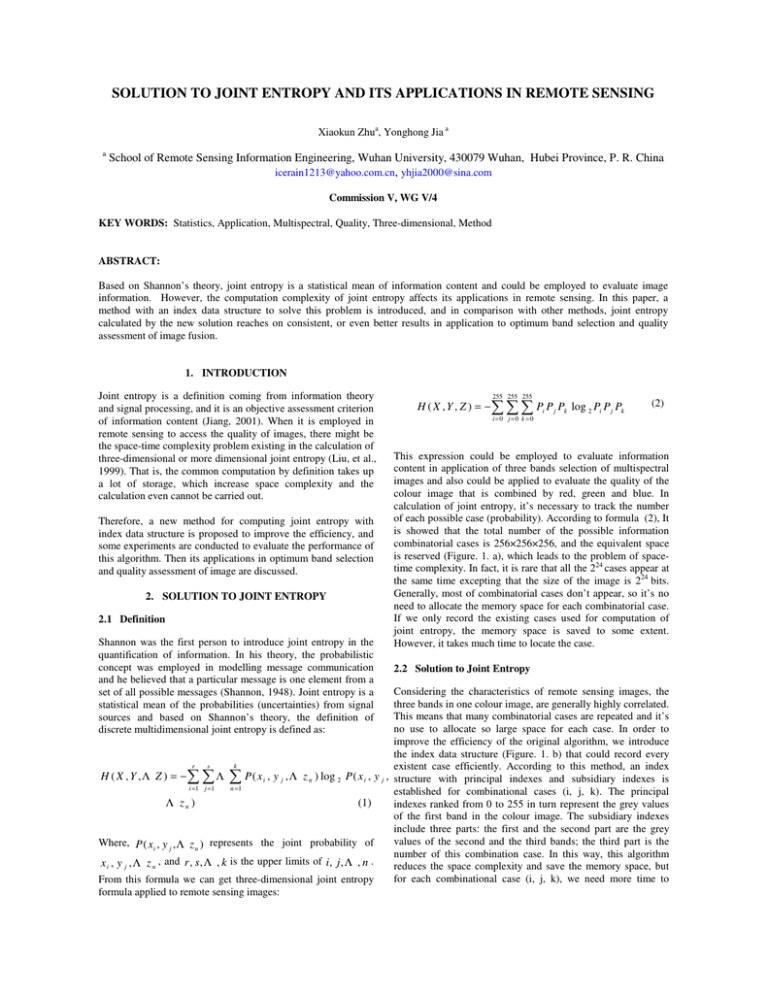
SOLUTION TO JOINT ENTROPY AND ITS APPLICATIONS IN REMOTE SENSING Xiaokun Zhua, Yonghong Jia a a School of Remote Sensing Information Engineering, Wuhan University, 430079 Wuhan, Hubei Province, P. R. China icerain1213@yahoo.com.cn, yhjia2000@sina.com Commission V, WG V/4 KEY WORDS: Statistics, Application, Multispectral, Quality, Three-dimensional, Method ABSTRACT: Based on Shannon’s theory, joint entropy is a statistical mean of information content and could be employed to evaluate image information. However, the computation complexity of joint entropy affects its applications in remote sensing. In this paper, a method with an index data structure to solve this problem is introduced, and in comparison with other methods, joint entropy calculated by the new solution reaches on consistent, or even better results in application to optimum band selection and quality assessment of image fusion. 1. INTRODUCTION Joint entropy is a definition coming from information theory and signal processing, and it is an objective assessment criterion of information content (Jiang, 2001). When it is employed in remote sensing to access the quality of images, there might be the space-time complexity problem existing in the calculation of three-dimensional or more dimensional joint entropy (Liu, et al., 1999). That is, the common computation by definition takes up a lot of storage, which increase space complexity and the calculation even cannot be carried out. Therefore, a new method for computing joint entropy with index data structure is proposed to improve the efficiency, and some experiments are conducted to evaluate the performance of this algorithm. Then its applications in optimum band selection and quality assessment of image are discussed. 2. SOLUTION TO JOINT ENTROPY 2.1 Definition Shannon was the first person to introduce joint entropy in the quantification of information. In his theory, the probabilistic concept was employed in modelling message communication and he believed that a particular message is one element from a set of all possible messages (Shannon, 1948). Joint entropy is a statistical mean of the probabilities (uncertainties) from signal sources and based on Shannon’s theory, the definition of discrete multidimensional joint entropy is defined as: H (X ,Y , Z ) = − 255 255 255 i=0 j=0 k =0 Pi P j Pk log 2 Pi P j Pk (2) This expression could be employed to evaluate information content in application of three bands selection of multispectral images and also could be applied to evaluate the quality of the colour image that is combined by red, green and blue. In calculation of joint entropy, it’s necessary to track the number of each possible case (probability). According to formula (2), It is showed that the total number of the possible information combinatorial cases is 256×256×256, and the equivalent space is reserved (Figure. 1. a), which leads to the problem of spacetime complexity. In fact, it is rare that all the 224 cases appear at the same time excepting that the size of the image is 224 bits. Generally, most of combinatorial cases don’t appear, so it’s no need to allocate the memory space for each combinatorial case. If we only record the existing cases used for computation of joint entropy, the memory space is saved to some extent. However, it takes much time to locate the case. 2.2 Solution to Joint Entropy Considering the characteristics of remote sensing images, the three bands in one colour image, are generally highly correlated. This means that many combinatorial cases are repeated and it’s no use to allocate so large space for each case. In order to improve the efficiency of the original algorithm, we introduce the index data structure (Figure. 1. b) that could record every r s k existent case efficiently. According to this method, an index H ( X , Y ,Λ Z ) = − Λ P ( x i , y j , Λ z n ) log 2 P ( x i , y j , structure with principal indexes and subsidiary indexes is i =1 j = 1 n =1 established for combinational cases (i, j, k). The principal Λ zn ) (1) indexes ranked from 0 to 255 in turn represent the grey values of the first band in the colour image. The subsidiary indexes include three parts: the first and the second part are the grey values of the second and the third bands; the third part is the Where, P ( xi , y j , Λ z n ) represents the joint probability of number of this combination case. In this way, this algorithm x i , y j , Λ z n , and r , s , Λ , k is the upper limits of i, j , Λ , n . reduces the space complexity and save the memory space, but for each combinational case (i, j, k), we need more time to From this formula we can get three-dimensional joint entropy formula applied to remote sensing images: verdict whether this case has existed, which sacrifices the runtime efficiency. However, runtime is also very important, especially for realtime processing, even equal to space assigned, so the principal indexes are divided (Figure. 1. c) into four or more indexes, which is equivalent to increase of the number of the principal indexes. This improved method helps to reduce runtime (Table 1), but to some extent, increases the storage. Then this solution finally finds the balance between time and space of this algorithm. In order to test the efficiency of algorithm, the experiments are done to calculate three-dimensional joint entropy of TM images. The test data is TM multispectral images (six bands, except for thermal band 6) in Wuhan, China and the size is 1024×1024 pixels. Then total number of the combinatorial cases is 20.The comparisons of the runtime between index and improved index methods are partly listed in Table 1. Seq. 1 5 10 15 20 Bands Selected 3,4,5 4,5,7 1,5,7 2,3,5 1,2,3 Joint Entropy 15.1920 14.4935 14.0925 13.1894 11.3511 Runtime(s) Index Improved 163.313 49.531 54.265 22.610 82.000 25.547 55.844 30.859 1.718 1.360 Table 1. comparisons of the runtime for calculation of threedimensional joint entropy It' s showed in Table 1 that the greater the value of joint entropy is, the more the time cost by index or improved index solution generally is. The maximal runtime of index is 163.313s and the minimal is 1.718s; while the maximum of improved index is 49.531s, and the minimum is 1.360s. The result indicates that the new solution works more efficient than the conventional index method and has better stability. Figure 1. Solutions to joint entropy. a. represents the definition algorithm and the total number of units is 224. b. shows the index solution. c. shows the improved index solution. In order to get the expansibility of this new solution, we extend it to the calculation of multidimensional joint entropy the method and apply the method to the aerial hyper spectral image data (512×512 pixels) acquired near Poyang Lake, China with totally 30 bands. The computing results show the efficiency of six-dimensional joint entropy and they are partly listed in Table 2. Seq. 1 5 10 20 28 Bands Selected 5,6,7,9,10,12 6,7,8,9,10,12 6,7,9,10,11,12 5,8,9,10,11,12 5,6,7,8,9,10 Joint Entropy 17.8912 17.8868 17.8822 17.8688 17.8426 Runtime(s) 26.828 20.110 19.750 24.984 25.500 Table 2. Calculation of six-dimensional joint entropy From this experiment, the runtime of improved solution to calculate multidimensional joint entropy is acceptable. As we know, three optimum bands are not enough for hyper spectral band selection, and there is not only one best band triplet (Alejandra, 2003). Then according to practical needs, the new solution to multidimensional joint entropy could help divide groups to analyse the hyper spectral image data. 3. APPLICATION OF JOINT ENTROPY 3.1 Optimum Band Selection Based on Information Content Optimum band selection is first used to colour synthesizing for visual interpretation, so three-band selection is usually used. The principles of band selection (Beauchemin et al, 2001) are followed as: Whole information content of bands; Correlation among different channels; Class separability. Some statistical methods at different aspects such as OIF (Optimum Index Factor), SI (Sheffield Index) and CI (Crippen Index) and so on, are employed for optimum band selection. OIF (Chavez et al., 1982) is introduced to select a three-band combination having high variances and low pair-wise correlation. It mainly emphasizes the differences between bands. SI (Sheffiled, 1995; Beauchemin et al., 2001) is proposed based on the image covariance matrix of multispectral bands. Another optimum index CI (Crippen, 1989) is based on image correlation matrix and it minimizes the effect of redundant image content. All methods referred above follow the first two principles to select best triplet that has the highest information content and the lowest correlation. Joint entropy is a statistical mean of the probabilities of the grey-value combinations and could also used to be an assessment index of information content in remote sensing images. Joint entropy as the general criterion of the information content could be employed in application to optimum band selection. The formula is seen in section 2 (2) and the comparisons of these methods are showed in the experiments (Table 3). 3.2 Quality Assessment of Fused Imagery Quality assessment of image fusion is relatively new issue in recent years. A good fusion method lies on improving the spatial resolution of multispectral images as well as preserving their spectral characteristics. Various statistical methods are proposed to evaluate the quality of fused images. For example, average, entropy, variance, standard deviation, average gradient, correlation coefficient (Jia 2001; Li, 2000; Wang et al., 2002) of images have been employed for evaluation. The fused image can be evaluated both spectrally and spatially. The quality of spatial information could be judged by lucidity and local contrast of images and there are many methods for describing lucidity and contrast. For example, average gradient and variance are proposed to assess the details and variations in each channel of the merged image. And entropy is used to evaluate at the aspect of spatial information content. However, since there are redundancies between different channels of one fused image and entropy and average gradient can only be used to evaluate a single channel, the simple addition of entropies or gradients cannot represent the whole information of the fused image. Joint entropy eliminates the redundant information between channels and can solve this problem efficiently. 4. EXPERIMENTS AND RESULTS The following experiments include two sections: joint entropy applied to optimum band selection and applied to quality assessment of merged images. By experiments, the comparisons between joint entropy and other methods are discussed. 4.1 Optimum Band Selection The test data are the same as that of the above experiment in Table 1. SI, CI, OIF are also used to compare with joint entropy (JE), and the sequence results are showed in Table 3. Seq. 1 2 3 4 5 6 7 8 9 10 11 12 13 14 15 16 17 18 19 20 Triplets 3,4,5 1,4,5 3,4,7 1,4,7 4,5,7 2,4,5 3,5,7 2,4,7 1,3,4 1,5,7 1,3,5 2,5,7 1,3,7 2,3,4 2,3,5 1,2,4 1,2,5 1,2,7 2,3,7 1,2,3 JE 15.192 14.968 14.963 14.836 14.493 14.440 14.321 14.274 14.234 14.093 14.036 13.609 13.567 13.334 13.189 13.163 13.025 12.711 12.610 11.351 SI 4 6 1 3 19 5 14 2 7 18 8 16 9 13 15 10 11 12 17 20 CI 5 7 2 3 19 4 17 1 6 18 8 15 9 13 14 10 11 12 16 20 OIF 4 7 2 5 19 9 13 6 1 15 10 14 16 8 11 3 12 18 17 20 Table 3. Comparisons between JE and different methods in application to optimum band selection As is showed above, all these methods obtain optimum band combinations, such as 543, 743, 742, 741. Whether judged by visual effect or by local contrast, they’re all good triplets. This demonstrates that joint entropy could be applied to band selection. At the same time, the reasons for the ranking differences are the similarity of variances among different bands after adjustment of contrast. The similarity of variances causes OIF and SI only related to correlations between bands. OIF, SI, CI obtain the same sequences which might be a little different from reality, such as 431, the best triplet selected by OIF is not a good result. However, based on information content, joint entropy uses the probabilities of possible grey combinations instead of the variances and correlations, by which the optimum band selection could be judged more efficiently and this is why joint entropy is better than other statistical methods. 4.2 Experiment on Quality Assessment of fused images In order to evaluate the quality of fused images, the experiment is based on IKONOS 4m multispectral (MS) and 1m panchromatic images, which are taken from Beijing, China in 1999. Fusion methods such as IHS (Intensity, Hue, Saturation), PCA (Principal Component Analysis) and á trous wavelet transform (Pohl et al. 1998, Jia, 2001) are employed to obtain the fused images. Entropy, gradient and joint entropy are applied as quality assessment criteria and the results are listed in Table 4. Quality Assess Gradient Entropy JE Band R G B R G B - Origina l MS 8.079 7.517 7.804 4.912 4.528 4.933 6.788 Fusion Methods IHS PCA á trous 21.330 21.591 21.505 7.810 7.800 7.755 11.911 21.149 20.866 20.925 7.844 7.845 7.777 11.927 22.240 21.975 22.096 7.827 7.849 7.850 12.845 Table 4. Comparisons of joint entropy and different methods in application to quality assessment of fused images Compared with the original multispectral image, the entropy, gradient and joint entropy of any fusion method are much higher, which indicates that the spatial quality of fused images has improved greatly in details and local lucidity. According to Table 4, joint entropy can get the same results as other quality measures, where the superior is wavelet fusion method, the inferior are IHS and PCA. However entropy and gradient can only be used to calculate the single grey image. On one hand, it' s not convenient to compare the effects of colour-fused images, on the other hand, there are redundancies among the three channels in fused images and both of them cannot evaluate the whole spatial information precisely. As a criterion of the whole information content, joint entropy solves this problem efficiently. 5. CONCLUSIONS In order to reduce the space-time complexity of joint entropy, an alternative solution based on improved index data structure has been developed, and this solution can be extended to calculate the multidimensional joint entropy. The experiments were conducted to put this new solution into the applications to optimum band selection and quality assessment of fused images. Some available statistical techniques of these applications are also used to compare with joint entropy. It is showed that the results of joint entropy are consistent with those of other methods or even better. In application to optimum band selection, joint entropy can obtain good or better triplets compared with other methods; while used to evaluate the quality of remote sensing image data, joint entropy as a criterion is more apt to assess the spatial details in fused images and can get more exact results than other methods. All the experiments indicated that the improved algorithm of joint entropy could be used as an efficient image analysis tool in remote sensing. ACKNOWLEDGEMENTS The author would like to thank Mr. Li Junli in School of Remote Sensing Information Engineering, Wuhan University for valuable comments and suggestion. REFERENCES Alejandra, U. D. and Miguel, V. R., 2003. Determining the dimensionality of hyperspectral imagery. In: Algorithms and Technologies for Multispectral, Hyperspectral, and Ultraspectral Imagery IX. Beauchemin M. and Fung Ko B., 2001. On statistical band selection for image visualization. Photogrammetric Engineering & Remote Sensing, 67(5), pp. 571-574. Chavez, P. S., G. L. Berlin and L. B. Sowers, 1982. Statistical methods for selection Landsat MSS ratios. Journal of Applied Photographic Engineering. 8(1), pp. 23-30. Crippen, R. E., 1989. A simple spatial filtering technique for the cosmetic removal of scan-line noise from Landsat TM Ptape imagery. Photogrammetric Engineering & Remote Sensing, 55(3), pp. 327-331. Jia, Y. H., 2001. The Research on Methods and Applica-tions of Multi-source Remotely Sensed Image Data Fusion. Wuhan University Press, Hubei province, China. pp. 37-59. Jiang, D., 2001. Information Theory and Coding. University of Science and Technology of China Press, Hefei, pp.151-165. Li, J., 2000. Spatial quality evaluation of fusion of different resolution images. In: The International Archives of the Photogrammetry, Amsterdam, Vol. XXXIII, part B2, pp.339346. Liu, J. P. and Zhao, Y. S., 1999. Methods on optimal bands selection in hyperspectral remote sensing data interpretation. Journal of Graduate School, Academia Sinica, 16(2), pp. 153161. Pohl, C. and J. L. Van Genderen, 1998. Multisensor image fusion in remote sensing, concepts, methods and applications. International Journal of Remote Sensing, 19(5), pp. 823-854. Shannon, C. E., 1948. A mathematical theory of communication. Bell System Technical Journal, 27, pp. 379423 and 623-656. Sheffiled C., 1985. Selecting band combination from multispectral data. Photogrammetric Engineering & Remote Sensing, 51(5), pp. 681-687. Wang, Q., Sheng, Y. and Zhang, Y., 2002. A quantitative method to evaluate the performance of hyperspectral data fusion. IEEE Instrumentation and Measurement Technology Conference. Anchorage, AK, USA. pp. 919-923.


