Chapter 1: Function Fundamentals
advertisement
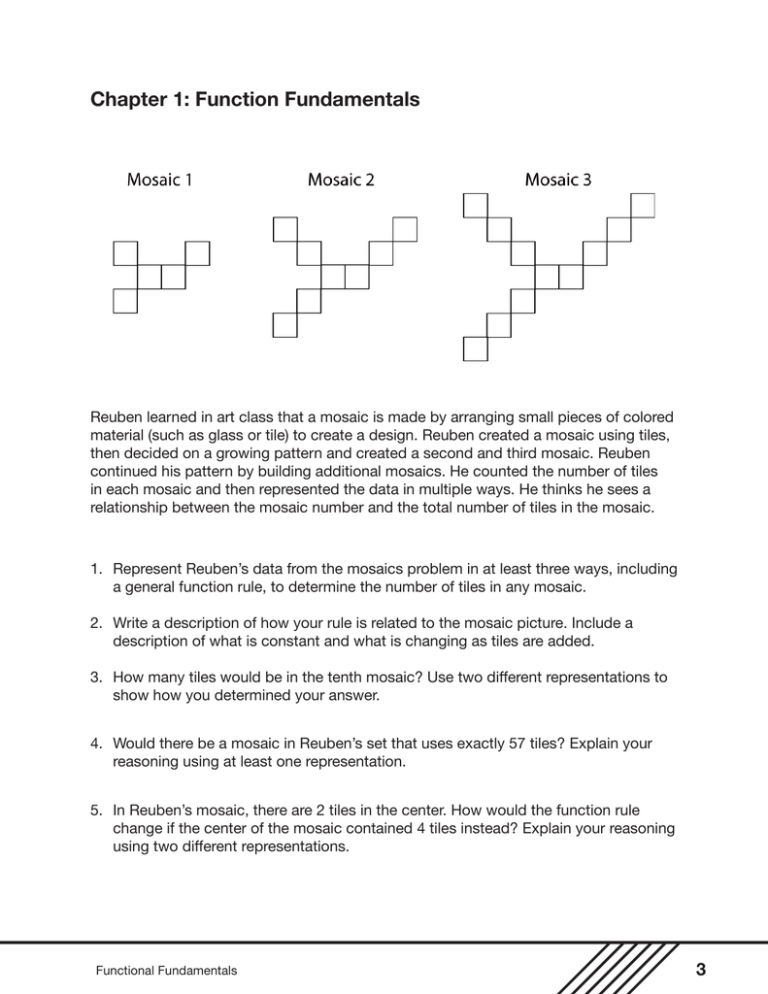
Chapter 1: Function Fundamentals Reuben learned in art class that a mosaic is made by arranging small pieces of colored material (such as glass or tile) to create a design. Reuben created a mosaic using tiles, then decided on a growing pattern and created a second and third mosaic. Reuben continued his pattern by building additional mosaics. He counted the number of tiles in each mosaic and then represented the data in multiple ways. He thinks he sees a relationship between the mosaic number and the total number of tiles in the mosaic. 1. Represent Reuben’s data from the mosaics problem in at least three ways, including a general function rule, to determine the number of tiles in any mosaic. 2. Write a description of how your rule is related to the mosaic picture. Include a description of what is constant and what is changing as tiles are added. 3. How many tiles would be in the tenth mosaic? Use two different representations to show how you determined your answer. 4. Would there be a mosaic in Reuben’s set that uses exactly 57 tiles? Explain your reasoning using at least one representation. 5. In Reuben’s mosaic, there are 2 tiles in the center. How would the function rule change if the center of the mosaic contained 4 tiles instead? Explain your reasoning using two different representations. Functional Fundamentals 3 Notes Scaffolding Questions: Materials: 30 tiles per student (optional) One graphing calculator per student Algebra TEKS Focus: (A.3) Foundations for functions. The student understands how algebra can be used to express generalizations and recognizes and uses the power of symbols to represent situations. The student is expected to: (A) use symbols to represent unknowns and variables; and (B) look for patterns and represent generalizations algebraically. Additional Algebra TEKS: (A.1) Foundations for functions. The student understands that a function represents a dependence of one quantity on another and can be described in a variety of ways. The student is expected to: (C) describe functional relationships for given problem situations and write equations or inequalities to answer questions arising from the situations; • Build or draw the next two mosaics. How many tiles are in each? • Make a table to record your data, including a process column. What remains constant in the relationship between the mosaic number and the number of tiles in your table? What changes? • Make a graph of the information from the table. How does your graph illustrate what is constant and what is changing in the problem situation? • What are the connections among the picture, verbal description, table, and graph? • How would you describe the relationship between the mosaic number and the number of tiles in each mosaic? • Which quantity depends on another quantity in this problem? • What is the rate of change for tiles with respect to the mosaic number? • On the graph for this problem situation, should a line connect the points? Explain why or why not. • Develop a rule to determine the number of tiles in the nth mosaic. What is constant and what is changing in your rule? • What is an appropriate domain and range for the mosaics situation? Sample Solutions: 1. Represent Reuben’s data from the mosaics problem in at least three ways, including a general function rule, to determine the number of tiles in any mosaic. Reuben’s data can be represented with a verbal description, graph, table, and function rule. Verbal description: One way to look at the mosaic is to see the 2 tiles in the center of the mosaic as the base. For each new mosaic, add 3 outside tiles. 4 Functional Fundamentals Graph: (D) represent relationships among quantities using concrete models, tables, graphs, diagrams, verbal descriptions, equations, and inequalities. Table: Mosaic Number Process Number of Tiles 1 2 + 3(1) 5 2 2 + 3(2) 8 3 2 + 3(3) 11 4 2 + 3(4) 14 5 2 + 3(5) 17 6 2 + 3(6) 20 … n 2 + 3(n) Rule: From the table, we can find the rule for the number of tiles, T, that is 2 plus 3 times the mosaic number, n, or T = 2 + 3n. 2. Write a description of how your rule is related to the mosaic picture. Include a description of what is constant and what is changing as tiles are added. The function rule is based on the picture of 2 tiles in the center and 3 tiles added for each new mosaic number. Functional Fundamentals (A.5) Linear functions. The student understands that linear functions can be represented in different ways and translates among their various representations. The student is expected to: (C) use, translate and make connections among algebraic, tabular, graphical, or verbal descriptions of linear functions. (A.7) Linear functions. The student formulates equations and inequalities based on linear functions, uses a variety of methods to solve them, and analyzes the solutions in terms of the situation. The student is expected to: (A) analyze situations involving linear functions and formulate linear equations or inequalities to solve problems. Texas Assessment of Knowledge and Skills: Objective 2: The student will demonstrate an understanding of the properties and attributes of functions. 5 As tiles are added, the 2 tiles in the middle are constant, and the number of tiles we add each time stays the same. What changes is the mosaic number. The total number of tiles depends on the mosaic number. From the graph you can see that for every new mosaic, the number of tiles increases by 3. If we followed the pattern in the graph back to mosaic 0, we would have the 2 tiles in the middle. We can also see the constant rate of change: For each new mosaic number, the number of tiles increases by the constant 3. We can see the relationship between the mosaic picture and the table: The 2 tiles in the center remain constant, and the 3 tiles added for each new mosaic are constant. What changes is the mosaic number. The total number of tiles depends on the mosaic number. In every representation, we see that the total number of tiles is the 2 you start with plus 3 tiles multiplied by the mosaic number. Alternative Solution: Some students may see the 5 tiles in the first mosaic as the base. The first mosaic then consists of only the base. For the mosaics after the first one, students add 3 tiles each time (or 3 times 1 less than the mosaic number). If this is how students see the pattern, then the process column in the table below will change to 5 + 3(mosaic number – 1). • Suppose Susan’s process is shown in the table below. What is her original mosaic pattern and how does it change? How does this compare to Reuben’s pattern? Mosaic Number Process Number of Tiles 1 5 + 3(0) 5 2 5 + 3(1) 8 3 5 + 3(2) 11 Susan’s function rule would be T = 5 + 3(n – 1), where n is the mosaic number. She saw the original mosaic base consisting of 5 tiles, and then began adding on 3 tiles starting with the second mosaic. She gets the same number of tiles for each mosaic number as Reuben, but she saw the pattern in a different way. 6 Functional Fundamentals Note: This activity provides an opportunity to explore what is the same and what is different about the two rules. The two rules, though different, are equivalent; that is, 5 + 3(n – 1) = 2 + 3n, but they represent two different ways of seeing the mosaic pattern. It is more important here for students to connect the way they “see” the pattern with the verbal description, rule, table, and graph. Although there is the opportunity here to illustrate the distributive property and combining like terms, these are not the objectives of the lesson. You may choose to revisit this activity later with a different focus. 3. How many tiles would be in the tenth mosaic? Use two different representations to show how you determined your answer. We can find how many tiles are in the tenth mosaic using the graph, table, or function rule. Graph: Table: Rule: T = 2 + 3(10) or 32 tiles 4. Would there be a mosaic in Reuben’s set that uses exactly 57 tiles? Explain your reasoning using at least one representation. To determine if there is a mosaic that has 57 tiles, we need to find the mosaic number that corresponds to 57 tiles. We can look at an extended table to determine the mosaic number, or we can look at the graph. Functional Fundamentals 7 In either case, we see that since the mosaic number must be a whole number, there is not a table entry or a point on the graph corresponding to exactly 57 tiles. We can also set up an equation that arises from the function situation and solve it. 57 = 2 + 3n 55 = 3n n= 55 1 = 18 3 3 Note: You may have students who will notice this possibility: If you split the one tile into three equal parts and add them to each end, they could use 57 tiles. Since n must be a whole number, there would not be a mosaic with exactly 57 tiles. 5. In Reuben’s mosaic, there are 2 tiles in the center. How would the function rule change if the center of the mosaic contained 4 tiles instead? Explain your reasoning using two different representations. If the center of the mosaic contained 4 tiles, the data in the table would change. Each point in the graph would be translated up by 2 units. 8 Functional Fundamentals Generating a new rule, we see the constant would be 4. The new rule would be T = 4 + 3n. Extension Questions: • If the function rule was T = 2 + 4n, describe the first two mosaics and the general rule. There would be 2 tiles in the center and 1 tile on each of the four corners for the first mosaic. The second mosaic would have 2 tiles in the center and 2 tiles at each of four corners. The general rule means that there are 2 tiles in the center and 4 tiles added for each new mosaic. • Draw the first three mosaics for the following function rules. Make a table for each and then graph the functions on the same axes. Describe similarities and differences. A. x + 3 = y Picture: Draw Mosaic #1 with 3 tiles in the center and 1 tile on one corner, Mosaic #2 with 3 tiles in the center and 2 tiles on one corner, and Mosaic #3 with 3 in the center and 3 tiles on one corner Graph: Functional Fundamentals 9 Table: Mosaic Number Number of Tiles 1 4 2 5 3 6 B. 4x + 3 = y Picture: Draw Mosaic #1 with 3 tiles in the center and 1 tile on each of the four corners, Mosaic #2 with 3 in the center and 2 tiles on each of the four corners, and Mosaic #3 with 3 tiles in the center and 3 tiles on each of the four corners. 10 Graph: Functional Fundamentals Table: Mosaic Number Number of Tiles 1 7 2 11 3 15 C. 4x + 6 = y Picture: Draw Mosaic #1 with 6 tiles in the center and 1 tile on each of the four corners, Mosaic #2 with 6 in the center and 2 tiles on each of the four corners, and Mosaic #3 with 6 tiles in the center and 3 tiles on each of the four corners. Graph: Table: Mosaic Number Number of Tiles 1 10 2 14 3 18 Functional Fundamentals 11


