Comparing Exact Probabilities to Empirical Probabilities
advertisement
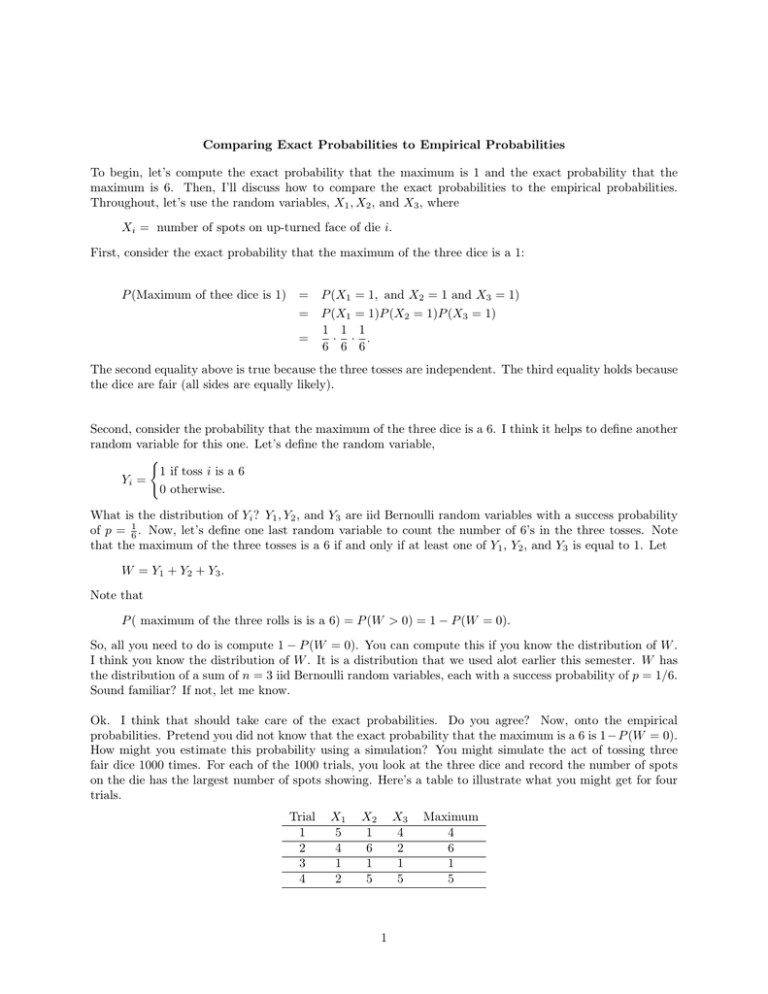
Comparing Exact Probabilities to Empirical Probabilities To begin, let’s compute the exact probability that the maximum is 1 and the exact probability that the maximum is 6. Then, I’ll discuss how to compare the exact probabilities to the empirical probabilities. Throughout, let’s use the random variables, X1 , X2 , and X3 , where Xi = number of spots on up-turned face of die i. First, consider the exact probability that the maximum of the three dice is a 1: P (Maximum of thee dice is 1) = P (X1 = 1, and X2 = 1 and X3 = 1) = P (X1 = 1)P (X2 = 1)P (X3 = 1) 1 1 1 = · · . 6 6 6 The second equality above is true because the three tosses are independent. The third equality holds because the dice are fair (all sides are equally likely). Second, consider the probability that the maximum of the three dice is a 6. I think it helps to define another random variable for this one. Let’s define the random variable, ( 1 if toss i is a 6 Yi = 0 otherwise. What is the distribution of Yi ? Y1 , Y2 , and Y3 are iid Bernoulli random variables with a success probability of p = 16 . Now, let’s define one last random variable to count the number of 6’s in the three tosses. Note that the maximum of the three tosses is a 6 if and only if at least one of Y1 , Y2 , and Y3 is equal to 1. Let W = Y1 + Y2 + Y3 . Note that P ( maximum of the three rolls is is a 6) = P (W > 0) = 1 − P (W = 0). So, all you need to do is compute 1 − P (W = 0). You can compute this if you know the distribution of W . I think you know the distribution of W . It is a distribution that we used alot earlier this semester. W has the distribution of a sum of n = 3 iid Bernoulli random variables, each with a success probability of p = 1/6. Sound familiar? If not, let me know. Ok. I think that should take care of the exact probabilities. Do you agree? Now, onto the empirical probabilities. Pretend you did not know that the exact probability that the maximum is a 6 is 1−P (W = 0). How might you estimate this probability using a simulation? You might simulate the act of tossing three fair dice 1000 times. For each of the 1000 trials, you look at the three dice and record the number of spots on the die has the largest number of spots showing. Here’s a table to illustrate what you might get for four trials. Trial 1 2 3 4 X1 5 4 1 2 X2 1 6 1 5 X3 4 2 1 5 1 Maximum 4 6 1 5 I only gave a table for 4 trials, but using the computer, you can generate 1000 trials. Once you’ve got your 1000 trials, count the number of trials in which the maximum is a 6 and divide that number by 1000 to get the proportion of trials in which the maximum is a 6. That proportion is the empirical probability that the maximum is 6. You can do the same thing for the other numbers. For example, you can count the number of trials in which the maximum is a 4 and then divide that number by 1000 to get the empirical probability that the maximum is a 4. After you have done this for the numbers 1, 2, 3, 4, 5, and 6, you will have the (empirical) probability mass function for the maximum of the three tosses. 2
