Using DHIA Records for Somatic Cell Count Management
advertisement

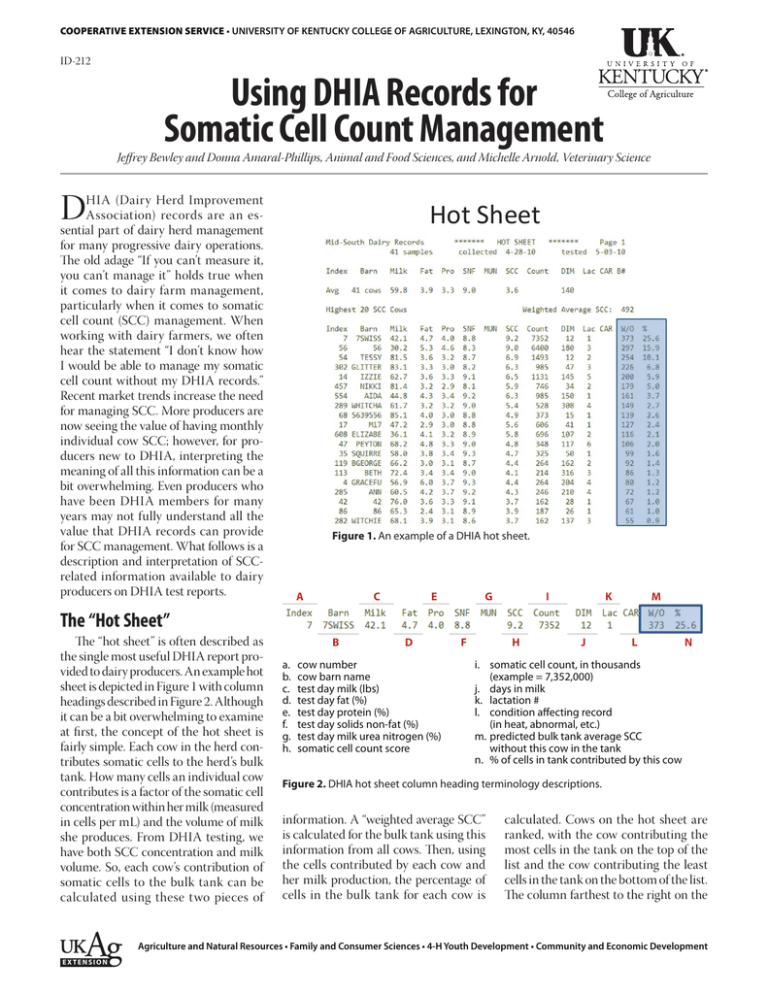
COOPERATIVE EXTENSION SERVICE • UNIVERSITY OF KENTUCKY COLLEGE OF AGRICULTURE, LEXINGTON, KY, 40546 ID-212 Using DHIA Records for Somatic Cell Count Management Jeffrey Bewley and Donna Amaral-Phillips, Animal and Food Sciences, and Michelle Arnold, Veterinary Science D HIA (Dairy Herd Improvement Association) records are an essential part of dairy herd management for many progressive dairy operations. The old adage “If you can’t measure it, you can’t manage it” holds true when it comes to dairy farm management, particularly when it comes to somatic cell count (SCC) management. When working with dairy farmers, we often hear the statement “I don’t know how I would be able to manage my somatic cell count without my DHIA records.” Recent market trends increase the need for managing SCC. More producers are now seeing the value of having monthly individual cow SCC; however, for producers new to DHIA, interpreting the meaning of all this information can be a bit overwhelming. Even producers who have been DHIA members for many years may not fully understand all the value that DHIA records can provide for SCC management. What follows is a description and interpretation of SCCrelated information available to dairy producers on DHIA test reports. Hot Sheet Figure 1. An example of a DHIA hot sheet. A C E G I K M The “Hot Sheet” The “hot sheet” is often described as the single most useful DHIA report provided to dairy producers. An example hot sheet is depicted in Figure 1 with column headings described in Figure 2. Although it can be a bit overwhelming to examine at first, the concept of the hot sheet is fairly simple. Each cow in the herd contributes somatic cells to the herd’s bulk tank. How many cells an individual cow contributes is a factor of the somatic cell concentration within her milk (measured in cells per mL) and the volume of milk she produces. From DHIA testing, we have both SCC concentration and milk volume. So, each cow’s contribution of somatic cells to the bulk tank can be calculated using these two pieces of B a. b. c. d. e. f. g. h. D cow number cow barn name test day milk (lbs) test day fat (%) test day protein (%) test day solids non-fat (%) test day milk urea nitrogen (%) somatic cell count score F H J L N i. somatic cell count, in thousands (example = 7,352,000) j. days in milk k. lactation # l. condition affecting record (in heat, abnormal, etc.) m. predicted bulk tank average SCC without this cow in the tank n. % of cells in tank contributed by this cow Figure 2. DHIA hot sheet column heading terminology descriptions. information. A “weighted average SCC” is calculated for the bulk tank using this information from all cows. Then, using the cells contributed by each cow and her milk production, the percentage of cells in the bulk tank for each cow is calculated. Cows on the hot sheet are ranked, with the cow contributing the most cells in the tank on the top of the list and the cow contributing the least cells in the tank on the bottom of the list. The column farthest to the right on the Agriculture and Natural Resources • Family and Consumer Sciences • 4-H Youth Development • Community and Economic Development EXTENSION hot sheet shows the percentage of cells in the tank from each cow in the herd. Moving left, the next column lists what the weighted average bulk tank SCC would be without that cow and all cows above her in the bulk tank. For most producers, these are the only two columns that need to be examined, though the other columns may provide additional useful information such as that cow’s somatic cell count (in thousands) and milk yield. Let us walk through an example using the information provided in Figure 1. For this herd, the weighted average SCC was 492,000 cells/mL. Cow 7 contributed the most somatic cells to the weighted SCC average. Her SCC was 7,352,000 cells/mL. She was responsible for 25.6 percent of the somatic cells in the bulk tank. Without including her in this average, the weighted average SCC for this milking would have been 373,000 cells/mL. Cow 56 contributed an additional 15.9 percent of the cells with a SCC of 6,400,000. Without these top two cows (Cows 7 and 56) the weighted average SCC for this milking would have been 297,000 cells/mL. We can quickly see the impact that only two cows had on the herd’s SCC. Cows with particularly high SCC or high milk production with moderately high SCC can have a huge impact on herd SCC, particularly in small herds. With larger herds, the impact that one cow has on SCC is smaller because this milk is diluted by the milk from other cows. This information can prove very valuable for dealing with a short-term high SCC problem. It is important to discuss a few limitations of the “hot sheet.” • The numbers reflect the samples collected from and the milk production of the cows on that particular milking on test day. SCC fluctuates considerably among individual cows from milking to milking. • The weighted average SCC may not match bulk tank SCC exactly because of differences in cows tested versus those included in the bulk tank and the fact that cows are sampled at one milking of the two or four milkings included in the bulk tank. For example, if cows sampled on DHIA test are treated and their milk withheld from the bulk tank, differences between the two herd SCC measures may occur. • If the highest SCC cows are removed from the herd, other cows will take their place on the top of the list. Part of this is just simple math indicating that a cow will be the highest SCC cow in the herd. Nevertheless, it is also important to realize that eliminating high SCC cows is only an emergency treatment of the problem without getting at its root cause. If you only focus on removing high SCC cows from the herd without determining why these cows have high SCC and how to incorporate preventive practices, you will continue to cull or dump milk from top SCC cows test after test. To fully benefit from the DHIA hot sheet, you may want to consider collecting milk samples for bacteriological culture for all cows with SCC greater than 200,000 for two consecutive months or at least the top 10 or 20 cows on the list. This practice would provide valuable information for developing prevention strategies and making individual cow treatment or culling decisions. Don’t be too quick to cull high SCC cows; make decisions based on multiple SCC and trends instead of a single cell count for a particular cow. The use of three consecutive monthly SCCs improves decision making, especially when combined with other cow factors such as age, stage of lactation, and time of year. First, check to see if high cows are chronically high SCC cows (“chronic cows” are defined as those with two consecutive months with a cell count >200,000 cells/ml in a single lactation). Those cows are the most likely culls. If the SCC is high on a single test, the cow may recover on her own or with the assistance of treatment. DHIA Herd Summary The DHIA herd summary (often DHI202 for records processed by Dairy Records Management Systems in Raleigh, NC) also provides valuable herd-level SCC information. The areas where SCC is located on the DHI-202 are highlighted in blue in Figure 3. Note that some producers may receive their reports with SCS (somatic cell score) rather than SCC (somatic cell count). This herd summary provides useful information for diagnosing the source of increased SCC within a 2 herd. For each test period (Figure 4) the herd production lost and the economic value of that milk are presented within the herd summary. Cows with a high SCC do not produce to their full potential, resulting in economic losses. This figure also presents the percentage of cows within various SCC concentrations or SCS by lactation number. This piece of information can be very useful toward distinguishing whether a mastitis problem exists in younger or older animals. If a higher percentage of first calf heifers have high SCC, prevention efforts should be focused on heifer rearing programs. If a higher percentage of cows with high SCC are observed in older cows, dry cow management and milking procedures may be examined. Finally, SCC distributions among SCC categories are also provided. Producers should strive to have greater than 85 percent of cows with SCC less than 200,000 cells/mL and less than 5 percent of cows with SCC greater than 1,130,000 cells/mL. In small herds, these numbers must be interpreted with caution because of the small number of cows represented in each category. A small herd makes it difficult to determine whether an observation is a herd or individual cow problem. Figure 5 depicts SCC categorized by stage of lactation and lactation number for the current test. Again, this information can be useful for pinpointing the source of an SCC problem. If SCCs are highest in early lactation, dry and fresh cow management should be examined. If SCCs are low in early lactation but increase during lactation, milking procedures and lactating cow housing may be examined. SCC concentrations increase in later lactation because of reduced milk production, which increases the concentration of somatic cells. For each lactation category, the percentage of cows with SCC greater than 200,000 cells/ mL (SCS >3.9) is presented. Producers should strive to have less than 15 percent of cows in this category. Figure 6 depicts SCC trends by test date. This information can be useful for identification of the time frame when SCC began to increase (i.e. change in equipment, employees, or weather). Additionally, this information can be helpful for identifying seasonal trends in SCC. Figure 3. Back side of DHIA herd summary with areas with SCC management information highlighted in blue. This represents how much milk income was lost because of elevated SCC Look for Differences by Lactation Number Figure 4. Current somatic cell count summary with income losses and SCC breakdowns by lactation. 3 PCDart graphs PCDart is a software program available to dairy producers on DHI test. For producers who have this software or work with a veterinarian or consultant who does, two graphs (Figures 7 and 8) provided by this program can be very useful. Both of these graphs can be accessed through the “Cow” graph button within PCDart. To create a graph like the one shown in Figure 7, select “Prev SCC vs Curr SCC.” To create a graph like the one shown in Figure 8, select “Prlc Last SCC vs 1st SCC.” After opening each graph, click the CrossHairs button on the bottom of the screen. Move both the horizontal and vertical CrossHairs to SCS of 4 (equivalent to SCC >240,000 cells/mL). This distinction defines all cows with SCC above this level as having mastitis. Each graph divides the herd into four quadrants. The upper right quadrant represents chronically infected cows or those with high SCC for both time periods. The upper left quadrant represents new infections where SCC was low for the first time frame and high for the second. The lower left quadrant represents consistently clean cows with low SCC for both time frames. Finally, the lower right quadrant represents cures where SCC was high during the previous time frame but low during the current time frame. Goals for each quadrant are listed in these graphs. Figure 7 shows the SCC for the current and the last DHI test. This graph demonstrates changes in SCC from month to month. If a high percent of the herd lies in the chronic infections quadrant, preventive efforts should be focused on control of contagious mastitis and on milking procedures. These chronic cows should be cultured. If a high percentage of the herd is in the new infections category, changes in the environment or milking procedures should be examined. Figure 8 depicts changes in SCC from one lactation to the next by comparing the SCC from the first test in a new lactation to the last test from the previous lactation. To an extent, this information provides an evaluation of the effectiveness of dry and fresh cow management. If too many cows are in the upper right quadrant, the dry cow program is not effective at controlling existing infections. Look for Trends by Stage of Lactation. For example, is SCC higher in early lactation? What percent of cows have SCCS > 3.9 (SCC> 200,000). Goal <15% Figure 5. SCC distribution by stage of lactation for each lactation group. Look for trends by season. Check when an increase started. Figure 6. SCC trends by test date. More problemetic would be scenarios where too many cows are in the upper left corner, indicating that cows developed new infections during the dry or fresh period. These situations would indicate a need to look at dry cow housing, environment, and preventive dry cow therapy, vaccination, dry cow nutrition, and calving facilities. As you can see, DHI provides a wealth of information from each test period from that one test. Additional or alternative graphs and tables may be available from different DHI processing centers, but the concepts hold true regardless. 4 This information can be extremely useful in efforts to lower SCC and diagnose SCC problems within a herd. Remember to consult with your veterinarian before changing any treatment or vaccination protocols to best target the pathogens responsible for an increased SCC. Remember that DHI testing is not for finding and culling the highest SCC cows each month in order to stay under the legal limit; rather it is a tool to help find the underlying causes of mastitis within a herd to help producers correct these problems. Prevention of mastitis is always more economical than treatments. % New Infections (Goal <5%) This Herd:29 Cows (13.5%) Consistently Clean Cows (Goal >85%) This Herd:130 Cows (60.5%) % Chronic Infections (Goal <15%) This Herd:32 Cows (14.9%) % Cures (Goal-more cures than new infections) This Herd:24 Cows (11.2%) Current Versus Last Test SCC Score Figure 7. PCDart Graph depicting distribution of SCC changes between tests. % New Infections (Goal <10%) This Herd:19 Cows (15.0%) Consistently Clean Cows (Goal >75%) This Herd:77 Cows (60.6%) % Chronic Infections (Goal <10%) This Herd:5 Cows (3.9%) % Cures (Goal-more cures than chronic infections) This Herd:26 Cows (20.5%) First Test SCS versus Last Test in Previous Lactation SCS Figure 8. PCDart graph depicting distribution of SCC changes between lactations. Educational programs of Kentucky Cooperative Extension serve all people regardless of race, color, age, sex, religion, disability, or national origin. Issued in furtherance of Cooperative Extension work, Acts of May 8 and June 30, 1914, in cooperation with the U.S. Department of Agriculture, M. Scott Smith, Director of Cooperative Extension Programs, University of Kentucky College of Agriculture, Lexington, and Kentucky State University, Frankfort. Copyright © 2013 for materials developed by University of Kentucky Cooperative Extension. This publication may be reproduced in portions or its entirety for educational or nonprofit purposes only. Permitted users shall give credit to the author(s) and include this copyright notice. Publications are also available on the World Wide Web at www.ca.uky.edu. Issued 4-2013


