Table 1: Sensitivity analysis for global PV buydown with output... optimized to maximize NPV
advertisement
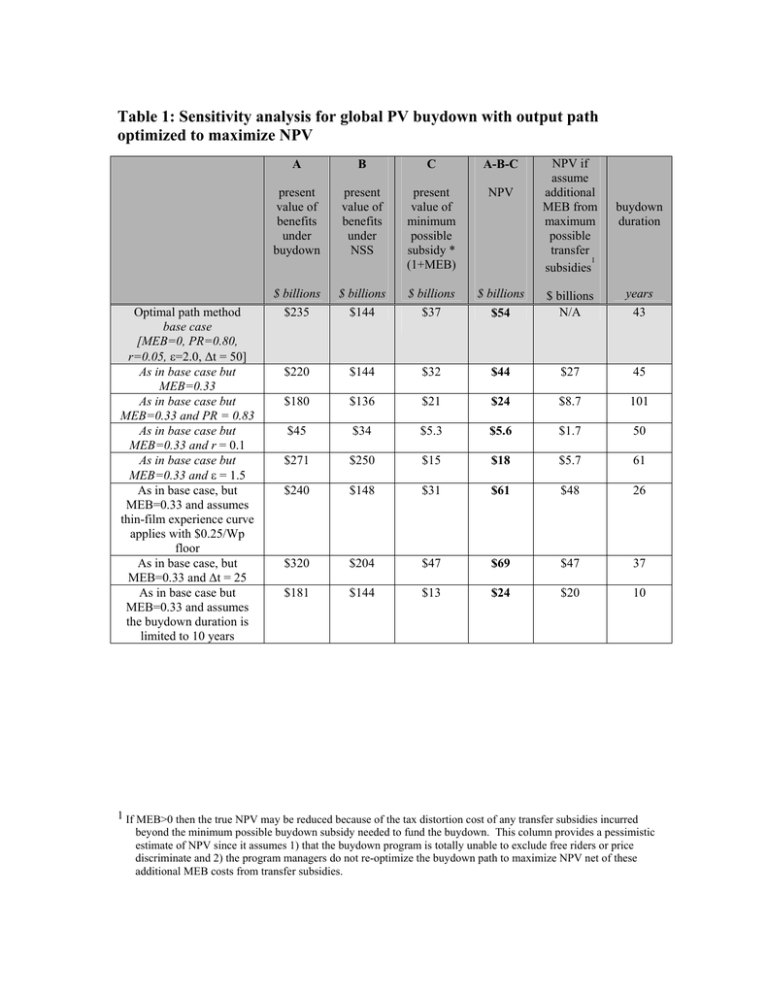
Table 1: Sensitivity analysis for global PV buydown with output path optimized to maximize NPV Optimal path method base case [MEB=0, PR=0.80, r=0.05, ε=2.0, ∆t = 50] As in base case but MEB=0.33 As in base case but MEB=0.33 and PR = 0.83 As in base case but MEB=0.33 and r = 0.1 As in base case but MEB=0.33 and ε = 1.5 As in base case, but MEB=0.33 and assumes thin-film experience curve applies with $0.25/Wp floor As in base case, but MEB=0.33 and ∆t = 25 As in base case but MEB=0.33 and assumes the buydown duration is limited to 10 years A B C A-B-C present value of benefits under buydown present value of benefits under NSS present value of minimum possible subsidy * (1+MEB) NPV $ billions $ billions $ billions $ billions $235 $144 $37 $220 $144 $180 NPV if assume additional MEB from maximum possible transfer 1 subsidies buydown duration years $54 $ billions N/A $32 $44 $27 45 $136 $21 $24 $8.7 101 $45 $34 $5.3 $5.6 $1.7 50 $271 $250 $15 $18 $5.7 61 $240 $148 $31 $61 $48 26 $320 $204 $47 $69 $47 37 $181 $144 $13 $24 $20 10 43 1 If MEB>0 then the true NPV may be reduced because of the tax distortion cost of any transfer subsidies incurred beyond the minimum possible buydown subsidy needed to fund the buydown. This column provides a pessimistic estimate of NPV since it assumes 1) that the buydown program is totally unable to exclude free riders or price discriminate and 2) the program managers do not re-optimize the buydown path to maximize NPV net of these additional MEB costs from transfer subsidies.
