Background Increasing Health Care Costs: the Price of Innovation?
advertisement
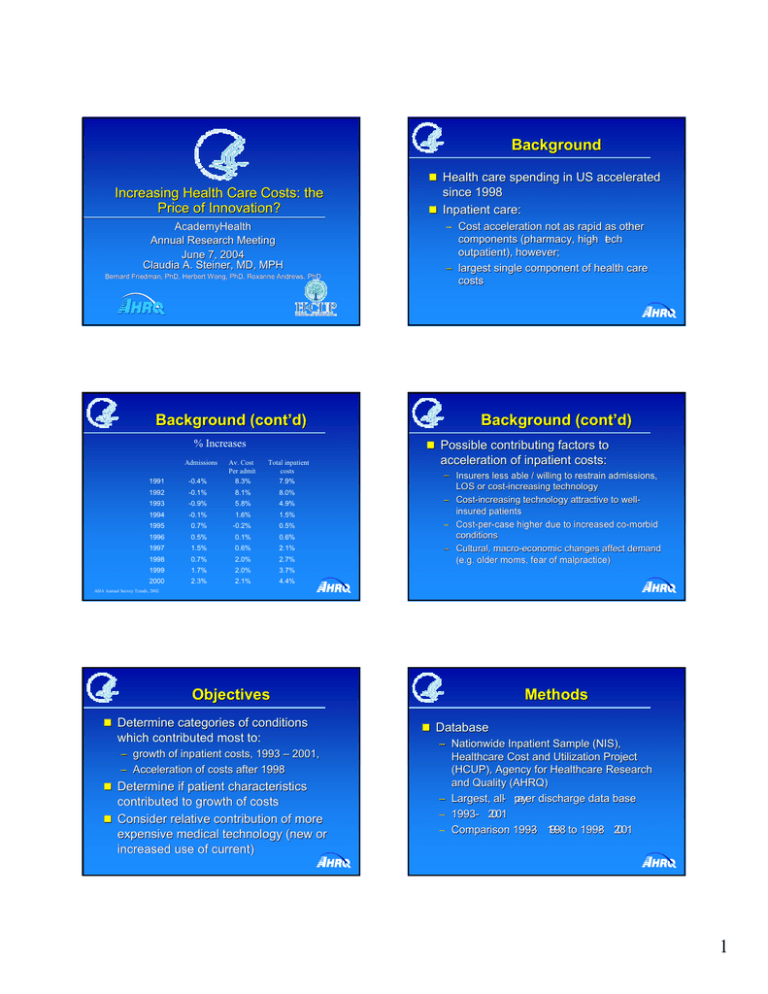
Background Health care spending in US accelerated Increasing Health Care Costs: the Price of Innovation? AcademyHealth Annual Research Meeting June 7, 2004 Claudia A. Steiner, MD, MPH Bernard Friedman, PhD, Herbert Wong, PhD, Roxanne Andrews, PhD Background (cont’d) % Increases Admissions since 1998 Inpatient care: – Cost acceleration not as rapid as other components (pharmacy, high - tech outpatient), however; – largest single component of health care costs Background (cont’d) Possible contributing factors to 1991 -0.4% Av. Cost Per admit 8.3% Total inpatient costs 7.9% 1992 -0.1% 8.1% 8.0% 1993 -0.9% 5.8% 4.9% 1994 -0.1% 1.6% 1.5% 1995 0.7% -0.2% 0.5% 1996 0.5% 0.1% 0.6% 1997 1.5% 0.6% 2.1% 1998 0.7% 2.0% 2.7% 1999 1.7% 2.0% 3.7% 2000 2.3% 2.1% 4.4% acceleration of inpatient costs: – Insurers less able / willing to restrain admissions, LOS or costcost-increasing technology – CostCost-increasing technology attractive to wellwellinsured patients – CostCost-perper-case higher due to increased coco-morbid conditions – Cultural, macromacro-economic changes affect demand (e.g. older moms, fear of malpractice) AHA Annual Survey Trends, 2002 Objectives Determine categories of conditions which contributed most to: – growth of inpatient costs, 1993 – 2001, – Acceleration of costs after 1998 Determine if patient characteristics contributed to growth of costs Consider relative contribution of more expensive medical technology (new or increased use of current) Methods Database – Nationwide Inpatient Sample (NIS), Healthcare Cost and Utilization Project (HCUP), Agency for Healthcare Research and Quality (AHRQ) – Largest, all- payer discharge data base – 1993- 2001 - 1998 to 1998 - 2001 – Comparison 1993 1 Methods (cont’d) Nationwide Inpatient Sample (NIS) – Approximates a 20% sample of community hospitals in US – Five sampling strata Region, bed size, teaching, urban/rural, ownership – Hospitals sampled from 17 states in 1993, 33 states in 2001 captures 85% of US discharges in 2001 – ~ 1000 community hospitals, ~ 7 million discharges – When weighted, represents estimated 37 million annual discharges Methods (cont’d) Clinical Classification System (CCS) – Created and maintained by AHRQ / HCUP staff – 267 mutually exclusive, clinically meaningful disease categories – Principal ICDICD-9-CM diagnoses grouped into CCS categories Charges – NIS data include total hospital charge for each discharge – Charges discounted to cost using methodology developed by AHRQ / HCUP economist Methods (cont’d) Analyses – Contribution of each CCS category to overall increase inpatient costs = initial share of total costs in 1993 x percent increase between 1993 and 2001 – CCS categories rank ordered by contribution to national increase of inpatient costs for 1993 – 2001 – Changes and contribution to cost increases determined for entire study period (1993(1993-2001) and 19931993-1998 vs. 19981998-2001 – Changes in severity of illness scores within category (APR(APR-DRG), average age, average LOS, volume of discharges investigated Results Discharges 0.09% Cost per Case 0.61% Annual Rate of Change 1998 - 2001 Discharges 2.18% Summary of Discharges and Growth in Costs, 1993- 2001 Mean Discharges Cost 2001 2001 Increase Total Costs, Inpatient Cost, 2001 1993– 1993–2001 37,175,339 $5,742.97 $231.9 bill. 21.9% Annual Rate of Change 1993 - 2001 Discharges Cost per Case 0.86% 1.62% Results Summary of Discharges and Growth in Costs, 1993 – 1998, 1998- 2001 Annual Rate of Change 1993 - 1998 Results Cost per Case 3.33% Top 50 CCS disease categories contributes 95% of overall increase in inpatient costs Comparing increase after 1998 to previous 5 years – 6 of top 50 disease categories had significant growth of admissions NonNon-specific chest pain, pregnancy, anemia, abdominal pain, benign neoplasm, connective tissue disorders) – 29 of top 50 disease categories had significant growth in cost per case 2 Results Results Changes in Cases and Cost per Case Changes in Cases and Cost per Case 14 10 8 8 6 4 2 0 -2 -4 1993-1998 1998-2001 ALL 1993-1998 1998-2001 Nonspecific Chest Pain 1993-1998 1998-2001 1993-1998 Pregnancy 1998-2001 Anemia 6 4 2 0 1993-1998 -6 Cases Average Annual % Change 10 Costs per Case 1998-2001 ALL -2 1993-1998 1998-2001 1993-1998 Abdominal Pain 1998-2001 Neoplasm 1993-1998 1998-2001 Connective Tissue CCS Categories CCS Categories Cases Results Costs per Case Results Changes in Cases and Cost per Case Average LOS declined more rapidly before 1998 than after (- 16.5% vs.- 3.6%) Increases in average age occurred before 1998 (4.8% vs. .5%) Severity of illness within disease categories (measured by APR - DRG) declined in most disease categories after 1998 9 8 Average Annual % Change Average Annual % Change 12 7 6 5 4 3 2 1 0 1993-1998 1998-2001 ALL 1993-1998 1998-2001 Acute MI 1993-1998 1998-2001 Back disc disorders 1993-1998 1998-2001 Cardiac Dysrhythmias CCS Disease Categories Cases Costs per Case Conclusions Hospital costs demonstrate a substantial contribution to the acceleration of health care costs 95% of the increase in hospital costs between 1993 and 2001 captured in 50 disease categories Grouping of conditions allows for more detailed investigation of contributing costs Conclusions A minority of the disease conditions demonstrated an increase in volume of admissions as the primary contributor to increase in costs – Insurers / payers may be less able or less willing to restrain admissions as managed care restrictions have eased – Fear of malpractice may contribute to some of these disease categories 3 Conclusions Majority of grouped conditions demonstrated an increase in cost per case as contribution to increase in hospital costs – Several conditions include medical technology changes Introduction of new medical innovation Changes in practice favoring more expensive technology Limitations Hospital discharge data have limited additional clinical information to further adjust severity Direct contribution of malpractice pressures and managed care easing of restrictions difficult to measure Avoidable costs due to inadequate preventive outpatient services warrant further investigation Conclusions LOS, though declining less rapidly postpost- 1998, continues to decline on average Patient characteristics do not appear to contribute to increase in cost per case – Average age not increased – Severity of illness declined for majority of conditions Future Studies More detailed study of individual disease categories to better define where, how and why cost per case are accelerated Local market area analyses, to include malpractice, payer mix and hospital concentration and competition, HMO penetration Implications for Policy and Delivery of Care In an era of easing managed care and other payer restrictions, new technologies and increase use of existing technology may be very important Other contributions to accelerated costs may be specific to disease categories and local market areas – Defensive practice styles, inadequate preventive outpatient services, hospital competition, patient demand 4
