Statistics Never Lie Childhood Obesity
advertisement

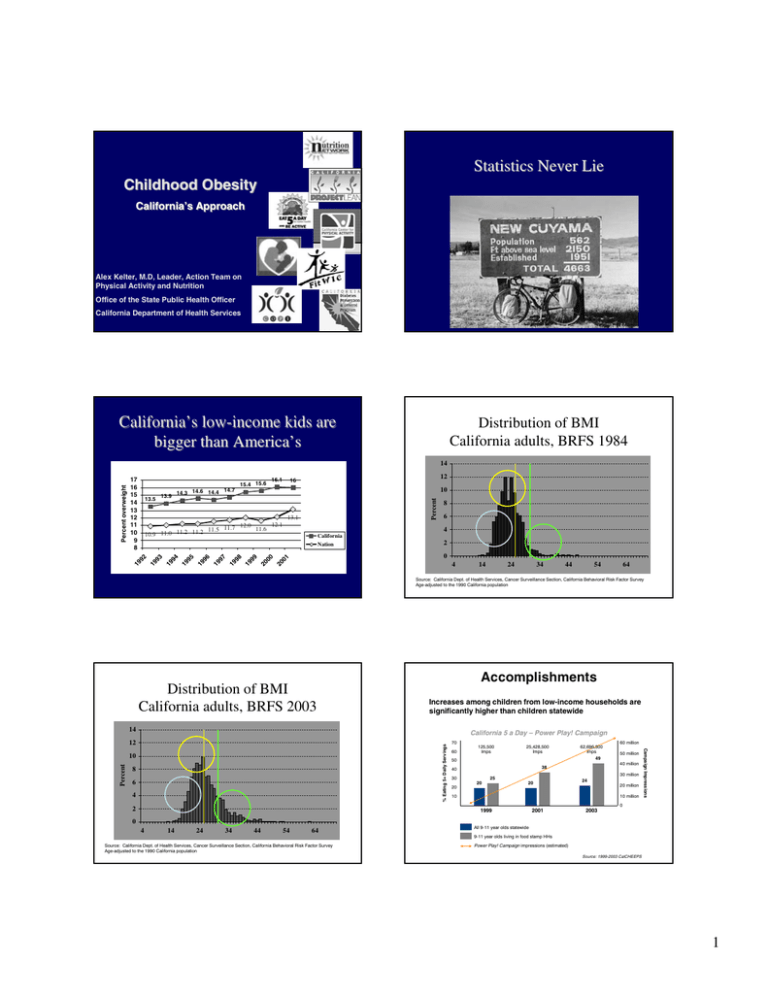
Statistics Never Lie Childhood Obesity California’s Approach Alex Kelter, M.D, Leader, Action Team on Physical Activity and Nutrition Office of the State Public Health Officer California Department of Health Services California’s low-income kids are bigger than America’s Distribution of BMI California adults, BRFS 1984 15.4 15.6 13.5 13.9 16.1 12 16 10 14.7 14.3 14.6 14.4 Percent 17 16 15 14 13 12 11 10 9 8 13.1 12.1 12.0 11.6 11.5 11.7 10.9 11.0 11.2 11.2 8 6 4 California Nation 2 0 19 92 19 93 19 94 19 95 19 96 19 97 19 98 19 99 20 00 20 01 Percent overweight 14 4 14 24 34 44 54 64 Source: California Dept. of Health Services, Cancer Surveillance Section, California Behavioral Risk Factor Survey Age-adjusted to the 1990 California population Distribution of BMI California adults, BRFS 2003 Accomplishments Increases among children from low-income households are significantly higher than children statewide 14 California 5 a Day – Power Play! Campaign Percent 10 8 6 4 70 60 125,500 Imps 25,428,500 Imps 50 30 50 million 30 million 25 20 60 million 40 million 38 40 20 62,696,500 Imps 49 20 24 10 20 million 10 million Campaign Impressions % Eating 5+ Daily Servings 12 0 2 1999 0 4 14 24 34 44 54 64 Source: California Dept. of Health Services, Cancer Surveillance Section, California Behavioral Risk Factor Survey Age-adjusted to the 1990 California population 2001 2003 All 9-11 year olds statewide 9-11 year olds living in food stamp HHs Power Play! Campaign impressions (estimated) Source: 1999-2003 CalCHEEPS 1 Accomplishments Gains in Minutes of Vigorous Activity and Meeting the Physical Activity Guideline Among California Children Despite limited resources, low-income Californians are keeping pace with statewide consumption trends. Nutrition Network & 5 a Day Campaign 31,751,131 Imps 330,693,252 Imps 44% 40% 40 33% 30 735,964,988 Imps 32% 30% 800 million 700 million 600 million 33% 34% 500 million 28% 400 million 300 million 20 200 million 10 100 million Campaign Impressions % Eating 5+ Daily Servings 50 0 1997 1999 2001 2003 Low income (<$25,000) adults All adults Mean Minutes 1999 2001 2003 Total Physical Activity 82 87 91 Light Physical Activity 17 14 16 Moderate Physical Activity 29 34 30 Vigorous Physical Activity 37 38 45** ** Percent of Children 1999 2001 2003 60 or More Minutes of 46 50 53 ** Moderate and/or Vigorous Physical Activity Total impressions (direct contacts and media impressions combined) Source: California Dietary Practices Survey, Unpublished 2001 Data, Preliminary 2003 Data SAAR California Success Senate Bill 19 (2000) Set standards for elementary schools Senate Bill 677 (2003) Removed sweetened beverages K-8 Notes: ** p<.01 SB 19: The Pupil Health and Achievement Act Established nutrition standards for foods sold at elementary schools Not more than 35% total calories from fat Not more than 10% total calories from saturated fat Not more than 35% total weight from sugar Allows only water, milk, and fruit juice with no less than 50% real juice, and no added sweeteners In middle schools no “carbonated” beverages are allowed from ½ hour before school until end of lunch SB 677 Visit Our Web Sites www.CaliforniaProjectLean CaliforniaProjectLean.org .org www. www.CaliforniaProjectLean.org Elementary Schools can provide: Only water, milk, and fruit juice with at least 50% fruit juice Middle Schools can provide: One half hour before and after the school day only water, fruit juice with at least 50% fruit juice, Teen Web Site: www.CaProjectLEAN.org milk, electrolyte replacement beverages with no more than 42g sweetener per 20 oz 2 California Project LEAN Awarded 2004 Innovation in Prevention Award by Secretary Tommy Thompson Martin Gonzalez, Esq., Assistant Executive Director, Policy Services, California School Boards Association; Victoria Berends, Marketing Manager, California Project LEAN Tommy Thompson Peggy Agron, M.A., R.D., Chief California Project LEAN California Center for Physical Activity Children’s Medical Services Maternal, Child and Adolescent Health Branch California Project LEAN Cancer Prevention & Nutrition Services ï 5 a day ï Nutrition Network California Department of Health Services Nutrition Nutrition and and Physical Physical Activity Programs Programs SB 1087: Safe Routes to School School Health Connections California Obesity Prevention Initiative Women, Infants, and Children Supplemental Nutrition Program ï WIC Farmer’s Market Nutrition Program Diabetes Prevention & Control Program DHS Action Team ï To confront the epidemic of over-eating and under-activityÖ ï Ö and its associated adverse health outcomes, includingÖ Type 2 Diabetes Hypertension, Stroke Coronary Disease Artery Poor bone health isolation Reduced social capital Increased disparities Social DHS Action Team includes: ï ï ï ï ï ï ï ï WIC MCH Rural Health Childrenís Med Svs Cancer Control Chronic Disease Injury Control Clin Prev Med ï ï ï ï ï ï ï ï Env/Occ Dis Cont Drinking Water Medi-Cal Public Affairs Lic & Cert Womenís Health Food Safety Labor Relations 3 Changes at all levels ï ï ï ï ï ï Individual Provider Community Environmental Policy Social Norms Action Teamís multi-focus ï ï ï ï Obesity Initiative California Moving- To A Better State of Health 2005 Improve Physical Activity Improve Nutrition Shift the population BMI Curve Make daily activity part of our routine, not an ìadd-onî activity Obesity Initiative (FY 05-06) California Moving -To A Better State of Health ï $6.0 million of State General Fund ! ï Establishes Coordinating Office in the Office of the State Public Health Officer Obesity Initiative (FY 05-06) California Moving-To A Better State of Health ï Components: ñ Community Action Grants ñ Healthcare Quality Improvement (Improving Nutrition and Physical Activity Care Collaborative-INPACC) ñ Tracking and Evaluation ñ Public Relations and Communications ñ Worksite Wellness 4 Healthcare Quality Improvement ï Improving Nutrition and Physical Activity Care Collaborative-INPACC ï $1.4 million ï Initial focus: MediCal children, implemented in up to six healthcare delivery systems ï Collaboration between providers, hospitals, communities, local health departments ï Components: Tracking and Evaluation ï $500,000 ï Track data from various environments related to obesity & monitor conditions that best support obesity prevention Zoning Codes School Siting and Accessibility ñ Breastfeeding Promotion ñ Preventive Services (increased screening, counseling, referral) ñ Treatment for overweight School Gardens Farmer’s Markets Public Relations and Communications ï $150,000 ï Place stories and shape coverage of Department Nutrition and Physical Activity programs and initiatives ï Build public awareness and support for a healthy environment The Governor’s Summit on Obesity Prevention Changing the Shape of California Transit-oriented Development Worksite Wellness ï $150,000 ï To be evaluated and used as model for other state agencies and businesses ï Build upon research from federally funded study to implement sustainable worksite wellness initiative at the Department of Health Services Expanding the Circle of Influence and Responsibility ï Under Governor Schwarzenegger's leadership, the Summit on Obesity Prevention will: ñ Bring together 100 private and public sector leaders who can make a difference (some of whom may not have yet taken on a role to prevent obesity) ñ Inspire these leaders to think differently about obesity and the opportunities we have to prevent it ñ Promote shared responsibility for making California a place where it is easier to make healthier choices 5 Threshold Principles Threshold Principles (continued) The Summit framework and participation are based on the following five principles: 4. Obesity prevention efforts require multiple solutions if widespread change is to be achieved 5. It is appropriate for government to provide leadership and work collaboratively with private and public sector leaders to change conditions and policies to promote healthy eating and regular physical activity 1. Obesity is a serious epidemic in California and throughout the United States 2. Our food and physical activity environments influence what we eat and our level of physical activity 3. Individuals are responsible for their own health and healthy options for nutrition and physical activity must be available and appealing Summit Participants will be Chosen from Multiple Sectors ï ï ï ï ï ï ï ï ï ï ï ï Education Business Food and Beverage Sports and Fitness Agriculture Healthcare/Health Insurance Building Industry Transportation Industry Public Health Community Based Organizations Voluntary Sector (AHA, ADA) Environmental Groups ï ï ï ï ï ï ï ï ï ï ï ï ï Built Environment Public Safety Corporate (GE, GM, Pepsi, P&G, etc) Faith-based Organizations Ethnic Communities Weight Loss Industry Disability Community Retailers Physical Activity Celebrities Advertising Labor Government (Fed, State and Local) Expected Outcomes ï ï ï ï Create a sense of urgency Identify and encourage actions Empower individuals Make communities, schools, and workplaces more attractive for physical activity and places where healthier food choices are available ï Create partnerships across sectors ï Create a roadmap for California The Summit Agenda ï Build shared understanding ï Create a common vision of success in preventing obesity ï Identify and prioritize barriers to achieving that vision ï Develop solutions to overcome those barriers ï Translate solutions to elements of a roadmap that Governor Schwarzenegger will promote and make happen Listening Sessions ï San Francisco (Nov 04) ï Los Angeles (Nov 04) ï San Diego (Jan 05) 6 2005 California Obesity Initiative Department-wide collaboration -Cancer Prevention and Nutrition Section -California Center for Physical Activity -Children’s Medical Services -California Project LEAN External partners -School Health Connections -California Obesity Prevention Initiative Agriculture -Women, Infants and Children Supplemental Nutrition Program -Maternal, Child, and Adolescent Branch -Diabetes Prevention & Control Program Innovative joint community initiatives Increased public awareness Education Environment Academia Collaborative healthcare quality improvement Tracking & Evaluation of conditions and environments related to obesity Healthy, sustainable worksite wellness programs Housing Transportation Parks 7


