Measurement of the Vortex Pair Interaction Potential in a Type-II...
advertisement

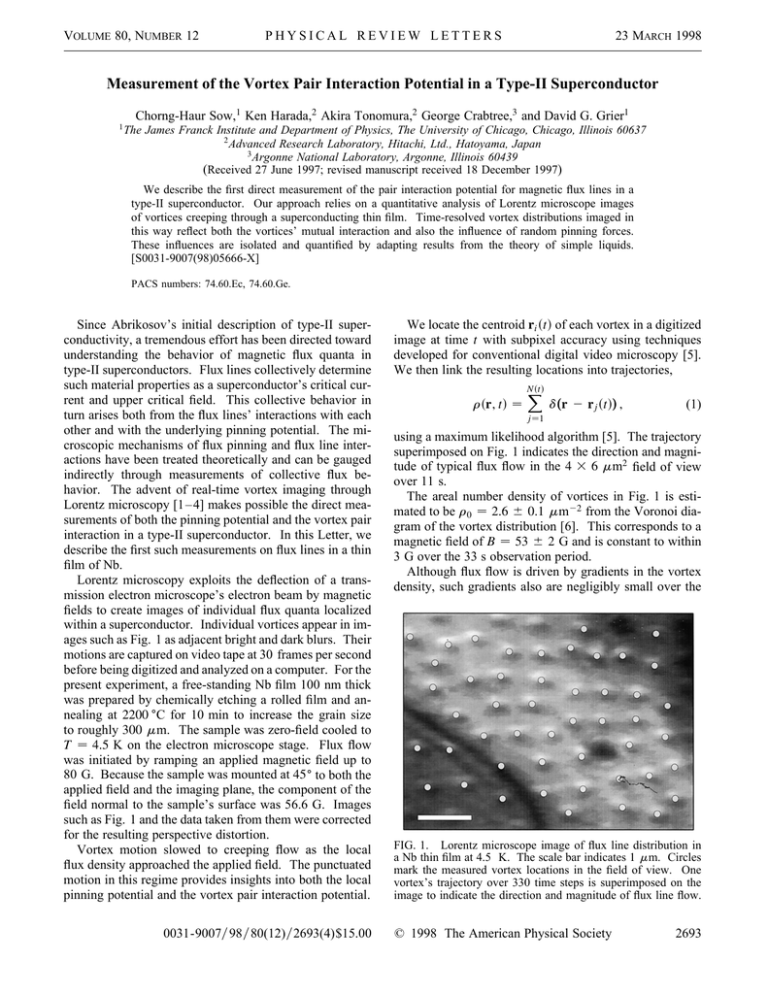
VOLUME 80, NUMBER 12 PHYSICAL REVIEW LETTERS 23 MARCH 1998 Measurement of the Vortex Pair Interaction Potential in a Type-II Superconductor Chorng-Haur Sow,1 Ken Harada,2 Akira Tonomura,2 George Crabtree,3 and David G. Grier1 1 The James Franck Institute and Department of Physics, The University of Chicago, Chicago, Illinois 60637 2 Advanced Research Laboratory, Hitachi, Ltd., Hatoyama, Japan 3 Argonne National Laboratory, Argonne, Illinois 60439 (Received 27 June 1997; revised manuscript received 18 December 1997) We describe the first direct measurement of the pair interaction potential for magnetic flux lines in a type-II superconductor. Our approach relies on a quantitative analysis of Lorentz microscope images of vortices creeping through a superconducting thin film. Time-resolved vortex distributions imaged in this way reflect both the vortices’ mutual interaction and also the influence of random pinning forces. These influences are isolated and quantified by adapting results from the theory of simple liquids. [S0031-9007(98)05666-X] PACS numbers: 74.60.Ec, 74.60.Ge. Since Abrikosov’s initial description of type-II superconductivity, a tremendous effort has been directed toward understanding the behavior of magnetic flux quanta in type-II superconductors. Flux lines collectively determine such material properties as a superconductor’s critical current and upper critical field. This collective behavior in turn arises both from the flux lines’ interactions with each other and with the underlying pinning potential. The microscopic mechanisms of flux pinning and flux line interactions have been treated theoretically and can be gauged indirectly through measurements of collective flux behavior. The advent of real-time vortex imaging through Lorentz microscopy [1–4] makes possible the direct measurements of both the pinning potential and the vortex pair interaction in a type-II superconductor. In this Letter, we describe the first such measurements on flux lines in a thin film of Nb. Lorentz microscopy exploits the deflection of a transmission electron microscope’s electron beam by magnetic fields to create images of individual flux quanta localized within a superconductor. Individual vortices appear in images such as Fig. 1 as adjacent bright and dark blurs. Their motions are captured on video tape at 30 frames per second before being digitized and analyzed on a computer. For the present experiment, a free-standing Nb film 100 nm thick was prepared by chemically etching a rolled film and annealing at 2200 ±C for 10 min to increase the grain size to roughly 300 mm. The sample was zero-field cooled to T ­ 4.5 K on the electron microscope stage. Flux flow was initiated by ramping an applied magnetic field up to 80 G. Because the sample was mounted at 45± to both the applied field and the imaging plane, the component of the field normal to the sample’s surface was 56.6 G. Images such as Fig. 1 and the data taken from them were corrected for the resulting perspective distortion. Vortex motion slowed to creeping flow as the local flux density approached the applied field. The punctuated motion in this regime provides insights into both the local pinning potential and the vortex pair interaction potential. 0031-9007y98y80(12)y2693(4)$15.00 We locate the centroid ri std of each vortex in a digitized image at time t with subpixel accuracy using techniques developed for conventional digital video microscopy [5]. We then link the resulting locations into trajectories, rsr, td ­ Nstd X dssr 2 rj stddd , (1) j­1 using a maximum likelihood algorithm [5]. The trajectory superimposed on Fig. 1 indicates the direction and magnitude of typical flux flow in the 4 3 6 mm2 field of view over 11 s. The areal number density of vortices in Fig. 1 is estimated to be r0 ­ 2.6 6 0.1 mm22 from the Voronoi diagram of the vortex distribution [6]. This corresponds to a magnetic field of B ­ 53 6 2 G and is constant to within 3 G over the 33 s observation period. Although flux flow is driven by gradients in the vortex density, such gradients also are negligibly small over the FIG. 1. Lorentz microscope image of flux line distribution in a Nb thin film at 4.5 K. The scale bar indicates 1 mm. Circles mark the measured vortex locations in the field of view. One vortex’s trajectory over 330 time steps is superimposed on the image to indicate the direction and magnitude of flux line flow. © 1998 The American Physical Society 2693 VOLUME 80, NUMBER 12 PHYSICAL REVIEW LETTERS field of view. The time-averaged maximum linear density gradient, directed along the direction ŷ of average flux motion, is =r ? ŷ ­ s2 6 1d 3 1023 r0 mm21 . The distribution of flux lines shows no long-range ordering. The sixfold bond-orientational order parameter, c6 sri , td ­ n 1 Xi exps6iuij d , ni j­0 (2) measures the degree of instantaneous local crystalline ordering between a vortex at ri and its ni nearest neighbors arrayed at angles uij with respect to a reference axis [7]. Its magnitude achieves the maximum value of jc6 j ­ 1 for a perfect Abrikosov lattice. The value of jc6 j ­ 0.41 6 0.03 averaged over our sample’s field of view and over time is appropriate for points randomly distributed in the plane. These observations suggest that the flux line distribution in the field of view is homogeneous, isotropic, and uniform over the course of our observations. In these respects, it resembles the distribution of atoms in a simple fluid [8]. The major difference is that disorder in fluids is driven by random thermal fluctuations while disorder in the flux line distribution reflects the quenched disorder of the pinning potential. Nevertheless, an ensemble average of statistically independent flux line distributions on the fixed pinning potential closely resembles the more familiar annealed average and may be interpreted to reveal similar aspects of the system’s interactions. The Lorentz force redistributing vortices among the pinning centers is sufficiently strong so that none of the vortices remain completely pinned throughout the experiment. Rather, the flux lines sample the potential surface over the entire field of view. The driving is weak enough, however, that the vortices are limited to creeping flow. For this reason, their configurations in a sequence of snapshots may be viewed as an ensemble of static distributions near equilibrium. Pinned flux lines are most likely to be found in regions where the local pinning energy V srd is most negative. Thus, we can use the time-averaged vortex distribution, 1 RT rsrd ­ T 0 rsr, tddt, to map out the spatial distribution of pinning centers. To do this, we coarse grain rsrd into regions comparable to the area subtended by a single flux line. Were the pinning potential featureless, such regions would be occupied with equal probability. The probability Psrddr of finding a vortex in a region of extent dr centered at r is a measure of the local depth of the pinning potential, ∂ µ V srd dr , (3) Psrd dr ­ exp 2 U0 where U0 is a characteristic energy scale. This energy scale is determined by the distribution of pinning energies rather than the thermal energy scale kB T at the low temperatures of this study. If kB T were larger than 2694 23 MARCH 1998 typical pinning energies, the vortices would have diffused randomly rather than undergoing punctuated bursts of motion. Similarly, if the mean pair potential were larger than typical pinning energies, the vortices would have formed a regular Abrikosov lattice. Instead, the pinning energy distribution distorted the vortex ensemble away from the ideal Abrikosov lattice while thermal energy activated hopping among pinning centers. The pinning energy landscape, or “pinscape,” calculated with Eq. (3) for the field of view appears in Fig. 2(a). Sample motion would introduce artifacts into the pinning potential map. We determined the vibration amplitude and tracking errors to be no greater than 10 nm, or roughly one pixel, by following the apparent motions of the dark feature in the lower right quadrant of Fig. 1. This defect was created by ion bombardment before the sample was mounted in the Lorentz microscope and serves as a fiducial mark. The dark bands, on the other hand, result from interference between electrons scattered by different atomic layers and so indicate slight sample curvature. Even our relatively small field of view contains enough pinning centers that we can estimate the distribution of pinning energies. This distribution appears in Fig. 2(b). FIG. 2. (a) Spatially resolved pinning potential V srd for the lower left region of Fig. 1 calculated from 990 video frames using Eq. (3). The spatial bins are 18 nm on a side, and the pinning energy is scaled according to the color bar on the right. (b) Number NsV d of spatial bins in (a) characterized by pinning potential V . The dashed line is a fit to Eq. (4). VOLUME 80, NUMBER 12 PHYSICAL REVIEW LETTERS While details of the distribution are not important for the discussion which follows, the measured distribution is reasonably well described by the form, NsV d ­ N0 exps2V yU0 d , (4) where NsV d is the number of spatial bins after coarse graining which contains a pinning center of depth V . The resemblance may be even better than indicated in Fig. 2 since our short data set undersamples weakly pinned regions while coarse graining overemphasizes strongly pinned regions. We identify the scale energy U0 from this distribution with the characteristic energy scale in Eq. (3). The resemblance to the Boltzmann distribution renders more compelling the analogy we draw between the vortex distribution in the quenched pinning potential and the distribution of particles under the influence of thermal forces. Numerical estimates for U0 become possible once the scale for vortex pair interactions is determined. While the ensemble-averaged vortex locations map out the pinscape, instantaneous pair correlations, R` k 2` rsx 2 r, tdrsx, tddxlu R` , (5) gsr, td ­ f 2` rsxddxg2 also reflect intervortex interactions. Here, k· · ·lu indicates an average over angles. Because a single video frame captures only about 50 vortices, many independent distributions must be averaged together to provide adequate statistics: 1 Z T gsr, td dt . (6) gsrd ­ T 0 The data in Fig. 3 represent an average over 990 video frames distributed into bins 4.4 nm, or half a pixel, on a side. We have confirmed that our results are insensitive to the choice of binning resolution, at least over the range 0.1–1 pixel. At low magnetic inductions for which multiple-vortex interactions can be ignored, the pair correlation gsrd is related to the vortex pair potential Usrd through the FIG. 3. Pair distribution function averaged over 990 video frames. 23 MARCH 1998 Boltzmann relation, Usrd ­ 2 lnfgsrdg . (7) U0 Without invoking a priori knowledge of the interaction’s range, we cannot assume that this is the case for our data set. Fortunately, results from the theory of liquid structure enable us to correct Eq. (7) for many-body effects. The structure of a homogeneous isotropic distribution of interacting particles is described by the OrnsteinZernike equation [8], c̃skd ­ h̃skd , 1 1 r0 h̃skd (8) where h̃skd is the Fourier-Bessel transform of the total correlation function hsrd ­ gsrd 2 1, and r0 is the mean number density of flux lines. The direct correlation function csrd is the inverse Fourier transform of c̃skd and is defined effectively by the Ornstein-Zernike equation. It can be related, at least approximately, to the pair interaction potential through a so-called closure relation [8]. Extensive work in the theory of liquid structure has identified closure relations which work best in systems characterized by long-ranged repulsive interactions such as the present vortex distribution. Of these, the hypernetted chain (HNC) relation Usrd ­ 2 lnfgsrdg 1 hsrd 2 csrd (9) U0 is found to be reasonably accurate and straightforward to implement [9]. Having measured gsrd experimentally, we use Eq. (8) to calculate the direct correlation function csrd and use the HNC closure to extract Usrd. The result, which appears in Fig. 4, is the first direct measurement of the pair interaction potential for flux lines in a type-II superconductor. FIG. 4. The pair interaction potential extracted from gsrd using Eqs. (8) and (9) The curve is a two-parameter fit to Eq. (10) for the London penetration depth l and the characteristic energy scale U0 . The arrow indicates the mean intervortex separation. Inset: the pair potential replotted to emphasize the functional form in Eq. (10). 2695 VOLUME 80, NUMBER 12 PHYSICAL REVIEW LETTERS Correlations between consecutive video frames tend to introduce correlated artifacts into Usrd. The weak minimum at r ­ 0.7 mm is likely to be such an artifact. Monte Carlo simulations of the analytical techniques introduced in this study [10] reveal that such correlations tend to systematically increase the measured slope of Usrd at small r. These systematic errors would be minimized in larger data sets sampled at greater time intervals than was possible in the present study. Since Eqs. (5), (8), and (9) do not rely on an assumed form for the interaction potential, the measured potential Usrd may be used to test theories for vortex interactions. For example, the solid line in Fig. 4 is a two-parameter fit to the London potential, w02 d Usrd ­ K0 sryld , U0 8p 2 l2 U0 (10) for the London penetration depth l, and U0 . The magnetic flux quantum is given by w0 ­ hcy2e ø 2 3 1027 G cm2 , d ­ 100 nm is the sample thickness, and K0 sxd is the modified Bessel function of zeroth order [11]. The extracted penetration depth l ­ 39.1 6 0.718 21 nm is consistent with the accepted value l ­ 45 6 1 nm [12] for Nb at T ­ 4.5 K. The error estimate for l includes both the 95% confidence interval from the fit to the data in Fig. 4 and also the range of errors estimated from Monte Carlo simulations [10]. The scale of pinning energies, U0 ­ 11 6 2 meV, is consistent with values obtained from flux lattice depinning studies in Nb thin films [13]. The data’s functional agreement with Eq. (10) can be judged from the inset in Fig. 4 which emphasizes the asymptotic exps2xdyx 1y2 behavior of K0 sxd for large x. The present study focused on a well-understood conventional superconductor whose behavior affords verification for the techniques described in this Letter. The same techniques can also be applied to layered, anisotropic, and high-Tc superconductors for which outstanding questions remain. For example, direct measurements of vortex interactions in NbSe2 or Bi2 Sr2 CaCu2 O8 could reveal the van der Waals attraction recently predicted [14] for vortices in layered superconductors. Straightforward extensions to the analysis presented above would shed light on the origin of the mixed vortex-chain–vortex-lattice state observed for layered superconductors in oblique fields [15]. Ongoing advances in Lorentz microscopy also will make possible studies over a range of applied fields and temperatures in the near future. We are grateful to M. D. Carbajal-Tinoco, S. N. Coppersmith, and M. Mungan for enlightening conversations. 2696 23 MARCH 1998 The work at The University of Chicago was supported in part by the MRSEC Program of the National Science Foundation under Award No. DMR-9400379 and in part through the Science and Technology Center for Superconductivity under Award No. DMR-9120000. One of us (G. C.) acknowledges support from the U.S. Department of Energy Office of Basic Energy Sciences-Material Sciences, under Contract No. W-31-109-ENG-38. C. H. S. acknowledges financial support from the National University of Singapore. [1] K. Harada et al., Nature (London) 360, 51 (1992). [2] A. Tonomura, Electron Holography, Springer Series in Optical Sciences Vol. 70 (Springer-Verlag, New York, 1993). [3] K. Harada et al., Science 274, 1167 (1996). [4] T. Matsuda et al., Science 271, 1393 (1996). [5] J. C. Crocker and D. G. Grier, J. Colloid Interface Sci. 179, 298 (1996). [6] F. P. Preparata and M. I. Shamos, Computational Geometry (Springer-Verlag, New York, 1985). [7] D. R. Nelson and B. I. Halperin, Phys. Rev. B 19, 2457 (1979). [8] J.-P. Hansen and I. R. McDonald, Theory of Simple Liquids (Academic, London, 1986), 2nd ed. [9] K.-C. Ng, J. Chem. Phys. 61, 2680 (1974). [10] M. Mungan, C.-H. Sow, S. N. Coppersmith, and D. G. Grier (to be published). [11] The Clem model for vortex interactions [J. R. Clem, J. Low Temp. Phys. 18, 427 (1975)] is more appropriate for Nb, whose superconducting coherence length is comparable to its London penetration depth. The present data set does not offer sufficient resolution to distinguish its predictions from those of the London model, however, and we present the simpler and quantitatively adequate model for clarity. [12] R. Meservey and B. B. Schwartz, in Superconductivity, edited by R. D. Parks (Marcel Dekker, New York, 1969), pp. 117–191. [13] G. S. Park, C. E. Cunningham, B. Cabrerra, and M. E. Huber, Phys. Rev. Lett. 68, 1920 (1992). [14] G. Blatter and V. Geshkenbein, Phys. Rev. Lett. 77, 4958 (1996); S. Mukherji and T. Nattermann, Phys. Rev. Lett. 79, 139 (1997). [15] C. A. Bolle et al., Phys. Rev. Lett. 66, 112 (1991); L. L. Daemen et al., Phys. Rev. Lett. 70, 2948 (1993); M. M. Doria and I. G. de Oliveira, Phys. Rev. B 49, 6205 (1994); I. V. Grigorieva et al., Phys. Rev. B 51, 3765 (1995).


