New Data, Same Story? A Replication of Studies Using National Public Health Acknowledgements
advertisement

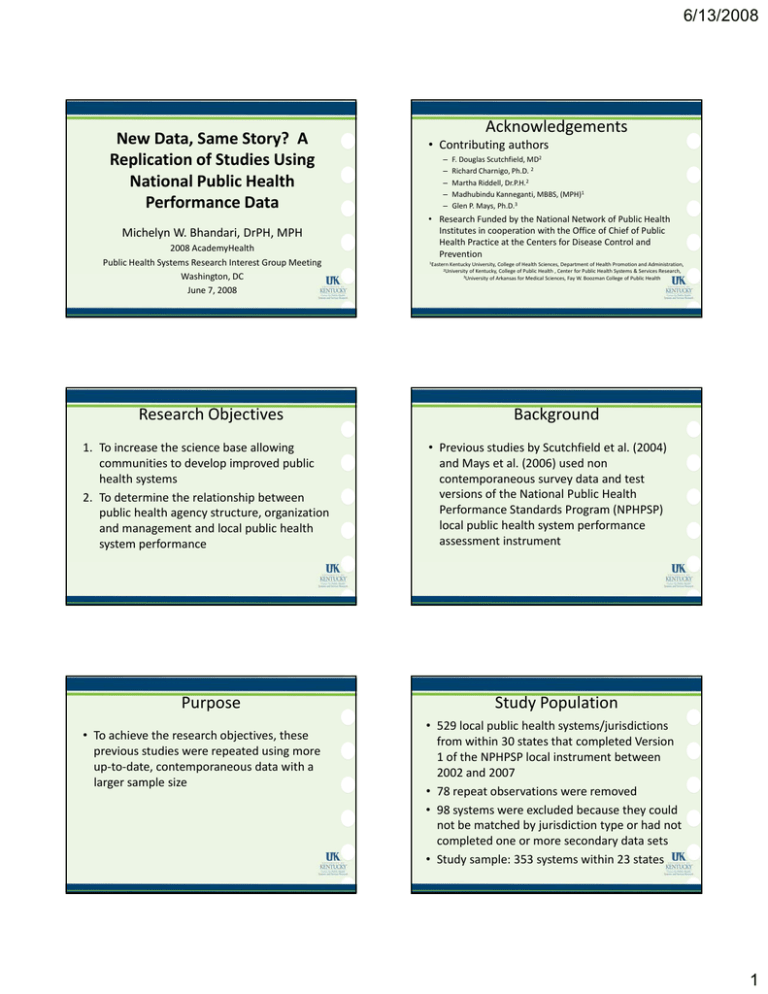
6/13/2008 New Data, Same Story? A Replication of Studies Using National Public Health Performance Data Michelyn W. Bhandari, DrPH, MPH 2008 AcademyHealth Public Health Systems Research Interest Group Meeting Washington, DC June 7, 2008 Research Objectives 1. To increase the science base allowing communities to develop improved public health systems 2 To determine the relationship between 2. To determine the relationship between public health agency structure, organization and management and local public health system performance Purpose • To achieve the research objectives, these previous studies were repeated using more up‐to‐date, contemporaneous data with a larger sample size larger sample size Acknowledgements • Contributing authors – – – – – F. Douglas Scutchfield, MD2 Richard Charnigo, Ph.D. 2 Martha Riddell, Dr.P.H.2 Madhubindu Kanneganti, MBBS, (MPH)1 Glen P. Mays, Ph.D.3 Glen P. Mays, Ph.D. • Research Funded by the National Network of Public Health Institutes in cooperation with the Office of Chief of Public Health Practice at the Centers for Disease Control and Prevention 1Eastern Kentucky University, College of Health Sciences, Department of Health Promotion and Administration, 2University of Kentucky, College of Public Health , Center for Public Health Systems & Services Research, 3University of Arkansas for Medical Sciences, Fay W. Boozman College of Public Health Background • Previous studies by Scutchfield et al. (2004) and Mays et al. (2006) used non contemporaneous survey data and test versions of the National Public Health of the National Public Health Performance Standards Program (NPHPSP) local public health system performance assessment instrument Study Population • 529 local public health systems/jurisdictions from within 30 states that completed Version 1 of the NPHPSP local instrument between 2002 and 2007 • 78 repeat observations were removed • 98 systems were excluded because they could not be matched by jurisdiction type or had not completed one or more secondary data sets • Study sample: 353 systems within 23 states 1 6/13/2008 Data: Dependent Variables Data: Independent Variables • Measures of system performance on the 10 Essential Public Health Services (EPHS) were obtained from Version 1 of the NPHPSP local public health system performance assessment public health system performance assessment instrument • EPHS score is the average of all indictors of the model standards that fall under an EPHS • 11 variables (1 for each EPHS & Overall) • Characteristics of public health agency structure, finance, organization and management were obtained from the 2005 NACCHO Profile (24 variables) • County‐level information on area demographic, socioeconomic, and health resource characteristics were obtained from the 2005 ARF (4 variables) • Federal public health spending was obtained from the Census Bureau’s 2005 Consolidated Federal Funds Report (CFFR) (1 variable) Analysis Table 1: Effects of system characteristics on performance of essential public health services: Standard Regression Estimates (Mays Study Repeat) Standardized Regression Coefficient (Standard Errors) • Computed cross‐sectional multivariate regression models to estimate associations between system characteristics and the performance of essential services Population size (1000s), log LHD spending per capita, $1000s, log Direct federal spending per capita, $1000s, log LHD staff per 100,000 population, log State‐local public health authority‐‐Centralized – Mays et al. (2006) entered independent variables which were selected a priori into mixed regression models with random effects that account for within‐state correlations – Scutchfield et al. (2004) entered stepwise only those variables which are significantly related to performance in the bivariate analysis into linear regression models State‐local public health authority‐‐Decentralized EPHS 1 EPHS 2 EPHS 3 EPHS 4 EPHS 7 EPHS 8 EPHS 9 EPHS 10 0.22 0.23 ‐0.02 0.06 0.11 0.28 0.00 ‐0.13 ‐0.04 0.24 (0.09)*** (0.08)*** (0.09) (0.09) (0.07) (0.08)*** (0.09) (0.08) (0.08) City/County jurisdiction type (0.08)*** ‐0.10 0.01 ‐0.05 ‐0.08 ‐0.01 ‐0.06 ‐0.03 0.12 ‐0.06 0.08 (0.09) (0.10) (0.11) (0.09) (0.10) (0.10) (0.10) (0.09) (0.10) ‐0.05 ‐0.04 0.01 ‐0.01 0.05 ‐0.03 0.03 0.03 ‐0.05 0.10 (0.06) (0.05) (0.06) (0.06) (0.05) (0.05) (0.06) (0.06) (0.05) (0.06)* 0.07 0.00 0.05 0.07 ‐0.03 0.12 0.09 0.02 ‐0.03 ‐0.15 (0.10) (0.10) (0.10) (0.11) (0.09) (0.10) (0.10) (0.10) (0.10) Physicians per capita, log R2 (0.10) ‐0.17 ‐0.08 0.08 ‐0.02 ‐0.11 ‐0.19 ‐0.06 ‐0.27 ‐0.09 ‐0.21 (0.15) (0.15) (0.16) (0.15) (.15) (0.16) (0.15) (0.16)** (0.15) (0.16) ‐0.11 ‐0.11 ‐0.10 ‐0.01 ‐0.03 ‐0.03 ‐0.17 ‐0.06 ‐0.18 (0.15) (0.17) (0.17) (0.16) (0.17) (0.17) (0.16) 0.03 ‐0.01 ‐0.08 ‐0.03 ‐0.04 ‐0.05 ‐0.17 ‐0.07 ‐0.01 (0.06) (0.07) (0.07) (0.06) (0.06) (0.07) (0.06)*** (0.06) (0.06) 0.00 ‐0.14 ‐0.12 ‐0.04 ‐0.07 ‐0.14 ‐0.09 (0.16) 0.16 (0.16) ‐0.07 (0.07) ‐0.15 ‐0.10 0.00 (0.06) (0.06)** (0.07)* (0.05) (0.06) (0.06)** (0.06)*** (0.06)* (0.06) 0.03 0.02 ‐0.01 ‐0.05 ‐0.04 ‐0.08 ‐0.01 ‐0.04 0.06 0.00 (0.06) (0.06) (0.07) (0.07) (0.05) (0.06) (0.06) (0.06) (0.06) (0.06) 0.07 0.05 0.11 0.07 0.01 0.03 0.03 0.11 0.19 0.06 (0.07) (0.07) (0.07) (0.08) (0.05) (0.07) (0.07) (0.07) (0.07)*** (0.07) 0.10 0.10 0.02 0.03 0.06 0.12 0.04 0.04 0.07 0.12 (0.06) Poverty rate EPHS 6 (0.10) (0.16) County jurisdiction type EPHS 5 *P<.10; **P<.05, ***P<.01 Conclusions: Same story? Table 2: Effects of system characteristics on performance of essential public health services: Standard Regression Estimates (Scutchfield Study Repeat) Log Population (5)* Local Board of Health (8)* EPHS 1 0.26 EPHS 2 0.30 EPHS 3 EPHS 4 EPHS 5 0.24 EPHS 6 0.34 ‐0.28 ‐0.26 ‐0.32 ‐0.36 ‐0.52 ‐0.37 0.22 0.22 0.33 0.23 Policy Making Board (7)* BOH‐‐Not Elected (2) EPHS 7 EPHS 8 ‐0.42 0.28 0.24 ‐0.40 Director‐‐Masters Degree (3) ‐0.21 EPHS 9 OVERALL 0.25 ‐0.22 ‐0.51 0.23 0.28 ‐0.44 ‐0.27 ‐0.16 Director‐‐MD, DDS, DVM (1) ‐0.15 Director‐‐Bachelor Degree (3) ‐0.20 ‐0.14 Director‐‐Nursing Degree (5)* 0.14 0.20 ‐0.15 0.13 0.11 0.12 Director‐‐Public Health (MPH, DrPH) (1) 0.19 ‐0.20 Log Per Capita Expenditures (1) • Findings confirmed from Mays (2006): – A larger population size is one of the strongest predictors of performance across many essential services; – Combined city‐county jurisdictions is an important predictor of performance for EPHS 3, inform and educate, predictor of performance for EPHS 3, inform and educate, and EPHS 7, link to health services; and – Direct federal spending per capita is an important predictor of improved performance on EPHS 10, research for new insights and solutions. 0.14 Log Expenditures (1) R2 EPHS 10 0.38 0.19 0.15 0.17 0.12 0.08 0.32 0.26 0.20 0.13 0.22 0.22 0.26 Number in parentheses represents the total number of EPHS for which there is a significant relationship; * = significant relationship with overall performance 2 6/13/2008 Conclusions: Same story? • Findings confirmed from Scutchfield (2004): – Increased population size is associated with improved performance on EPHS 10, research for new insights; – Existence of a local board of health that makes policy is associated with improved performance on EPHS 4, associated with improved performance on EPHS 4, mobilize community partnerships; – Local Health Department (LHD) Director with a nursing degree is associated with improved performance on EPHS 8, ensure a competent workforce; and – LHD Director with a public health degree is associated with lower performance on EPHS 10, research for new insights. Conclusions: New Story? • This study suggests that systems with a local board of health have poorer performance on many EPHS, yet… • Those that have a policy making board of Those that have a policy making board of health perform better on many of the EPHS Discussion • Findings from previous studies, this study, and another concurrent study by the authors suggest that local boards of health figure prominently in the performance of local public health systems/departments – Used cross‐sectional data – No consistent BOH indicator that reflects performance or that provides a measure of the quality and effectiveness of boards of health – Use this research to generate hypotheses for further research on the work of boards of health Conclusions: New Story? • Previous findings not confirmed: – Mays et al. (2006) found per capita spending of the LHD and the governmental relationship p between the state and local health departments (i.e. centralized, decentralized, etc.) influenced local public health performance – Scutchfield et al. (2004) found LHD Director with a public health background had poorer performance on many of the EPHS Discussion • Findings from this study indicate that we do not have enough evidence or clear evidence to make decisions about the optimal organization leadership and financing of organization, leadership, and financing of public health systems References • Mays, G.P, McHugh, M.C, Shim, K, Perry, N., Lenaway, D., Halverson, P.K., and Moonesinghe, R. (2006). Institutional and Economic Determinants of Public Health System Performance. American Journal of Public Health, 96 (3):523‐531. • Scutchfield, F.D., Knight, E.A., Kelly, A.V., Bhandari, M.W., and Vasilescu, I.P. (2004) Local Public Health Agency Capacity and its Relationship to Public Health System Performance. Journal of Public Health Management and Practice, 10 (3): 204‐215. 3 6/13/2008 Contact Information Michelyn Wilson Bhandari, DrPH, MPH Eastern Kentucky University Department for Health Promotion and Administration 420 Begley 521 Lancaster Ave 420 Begley, 521 Lancaster Ave. Richmond, KY 40475 michelyn.bhandari@eku.edu 859.622.1145 QUESTIONS?? 4


