O&M TOA BY SERVICE BY APPROPRIATION

O&M TOA BY SERVICE BY APPROPRIATION
Army
Army
Army Reserve
Army National Guard
($ in Millions)
FY 2002 FY 2003 FY 2004 FY 2005
Actual Price Program Estimate Price Program Estimate Price Program Estimate
31,182.0
+550.7
-1,723.3
30,009.4
+610.9
+508.6
31,128.9
+795.0
+446.3
32,370.2
25,668.5
+420.8
-2,263.1
23,826.2
+468.9
+670.3
24,965.4
+672.7
+152.1
25,790.2
1,766.6
3,746.9
+43.9
+133.1
1,943.6
+86.0
+406.7
4,239.6
+44.8
+97.2
-36.3
1,952.1
-125.4
4,211.4
+39.9
+27.4
2,019.4
+82.4
+266.8
4,560.6
Navy
Navy
Marine Corps
Navy Reserve
Marine Corps Reserve
32,401.7
+657.7
+953.6
34,013.0
+526.9
-1,499.7
33,040.2
+842.4
28,284.6
+581.5
+238.5
29,104.6
+446.9
-1,263.8
28,287.7
+747.5
2,964.7
1,012.6
139.8
+59.6
+12.6
+4.0
+497.1
+183.1
+34.9
3,521.4
1,208.3
178.7
+49.0
+28.1
+2.9
-163.7
-64.5
-7.7
3,406.7
1,171.9
173.9
+66.3
+25.8
+2.8
-5.6
-197.8
+196.9
-16.6
+11.9
33,877.0
28,837.4
3,669.9
1,181.1
188.6
Air Force
Air Force
Air Force Reserve
Air National Guard
34,294.2
+640.4
-1,614.7
33,319.9 +1,864.7
28,360.1
+488.9
-1,770.9
27,078.1 +1,429.4
1,999.0
+38.5
+112.5
2,150.0
+132.5
3,935.1
+113.0
+43.7
4,091.8
+302.8
-808.8
34,375.8 +1,349.1
-713.5
27,794.0 +1,054.6
-103.3
2,179.2
+84.6
+8.0
4,402.6
+209.9
-157.4
35,567.5
+84.0
28,932.6
-29.4
2,234.4
-212.0
4,400.5
Defense-Wide and Other
Defense-Wide
Emergency Response Fund,
Defense
Former Soviet Union Threat
Reduction
Overseas Humanitarian,
Disaster and Civic Aid
Payment to Kah’olawe
Island
27,323.4
+728.3
-9,902.4
18,149.4
+363.2 -98.4
18,414.2
+462.0
+977.1
19,853.0
13,540.1
+522.3
+754.2
14,816.6
+315.4 +1,438.8
16,570.8
+433.5
+76.9
17,081.2
13,232.8
+198.5 -12,019.5
1,411.8
400.2
49.4
76.0
+4.4
+1.6
+1.1
+9.8
+7.1
-2.1
414.4
58.1
75.0
+21.2
+6.2
-1.4
+1.1
-1,433.0
+30.2
+2.4
-76.1
450.8
59.0
-
-
+7.2
+1.1
-
-
-47.8
-0.5
-
-
410.2
59.6
-
-
O&M TOA BY SERVICE BY APPROPRIATION 1
O&M TOA BY SERVICE BY APPROPRIATION
U.S. Court Of Appeals For
The Armed Forces
Support for International
Sporting Competitions
Environmental Restoration,
Army*
Environmental Restoration,
Navy*
Environmental Restoration,
Air Force*
Environmental Restoration,
Defense-Wide*
Environmental Restoration,
Formerly Used Defense
Sites*
Overseas Contingency
Operations Transfer Fund*
($ in Millions)
FY 2002 FY 2003 FY 2004 FY 2005
Actual Price Program Estimate Price Program Estimate Price Program Estimate
9.0
15.9
(387.1)
(255.1)
(382.8)
(23.3)
(220.7)
(12.6)
+0.2
+0.2
-
-
-
-
-
-
+0.3
+2.8
+393.7
+255.5
+387.6
+24.3
+246.9
+37.0
9.6
18.9
393.7
255.5
387.6
24.3
246.9
37.0
+0.2
+0.3
+5.9
+3.8
+5.8
+0.4
+3.7
+0.6
+0.6
-19.2
-3.6
-3.2
-9.1
-0.6
-38.0
+12.4
10.3
396.0
256.2
384.3
24.1
212.6
50.0
-
+0.3
+5.9
+3.8
+5.8
+0.4
+3.2
+0.8
-
+0.3
+7.8
+8.3
-0.8
+1.7
+931.2
-
-
10.8
401.9
267.8
398.4
23.7
217.5
981.9
-
Total Obligational
Authority
Financing Adjustments
Total Budget Authority
125,201.3 +2,577.1 -12,286.8 115,491.7 +3,365.7
-1,898.3 116,958.9 +3,448.5 +1,260.4 121,667.4
-9,110.1
116,091.2
-
-
-1,724.6
- 113,767.1
-
-
243.6
- 117,202.5
-
-
243.4
- 121,910.9
*Transfer Accounts. The FY 2002 data is non-additive. The Department transfers these program funds to other appropriations (primarily Operations and Maintenance appropriations) where the Components manage, obligate, and expend the transferred funds for the purposes appropriated.
**Defense Health Program, the Office of Inspector General, and Drug Interdiction and Counterdrug Activities, Defense include multiple appropriations in its total, therefore, have been excluded from the chart above.
***Totals may not add due to rounding.
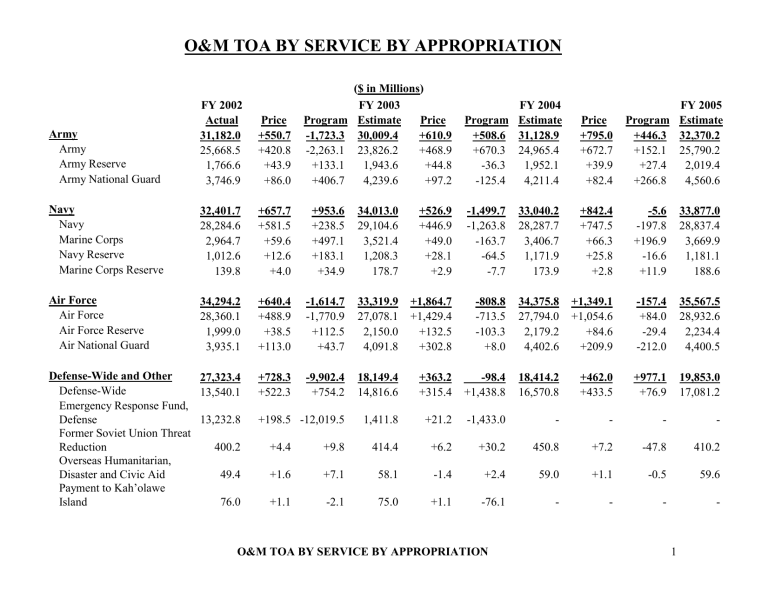
The amounts reflected in this Overview are expressed in Total Obligational Authority (TOA) terms, which includes Budget Authority (BA) and financing adjustments. The previous summary table identifies the TOA by appropriation within the Operation and Maintenance
O&M TOA BY SERVICE BY APPROPRIATION 2
O&M TOA BY SERVICE BY APPROPRIATION
(O&M) Title and also identifies the net financing adjustments. The FY 2003 financing adjustment of $-1,724.6 million includes contributions from allied nations for Defense Burdensharing ($+210.0 million), receipts involving disposal, lease, or recovery of DoD facilities and real property ($+32.3 million), and restoration efforts at the Rocky Mountain Arsenal and Kaho’olawe Island ($+80.7
million). These financing adjustments are offset by (1) $1,411.8 million unobligated balance brought forward for Defense Emergency
Response Fund (DERF) allocated to the DoD in FY 2001; (2) $32.1 million unobligated balance carried forward for the Overseas
Contingency Operations Transfer Fund; (3) $603.8 million unobligated balance carried forward associated with special multi-year funding included in the Emergency Supplemental Act, 2001 (Title I, Chapter 2 of P.L. 107-20), FY 2002 DoD Appropriations Act (Title VIII,
Section 8131 of P.L. 107-117), and FY 2002 Supplemental Appropriation Act (Title I, Chapter 3 of P.L. 107-206).
The FY 2004 financing increase of $243.6 million is due to contributions for Defense burdensharing ($+210.0 million), restoration efforts at the Rocky Mountain Arsenal ($+10.2 million), and receipts involving disposal, lease, or recovery of DoD facilities and real property
($+23.4 million).
O&M TOA BY SERVICE BY APPROPRIATION 3


