Printing: Hunger at the household level: A baseline study of food... Nicaragua International Center for Food Industry Excellence (ICFIE)
advertisement

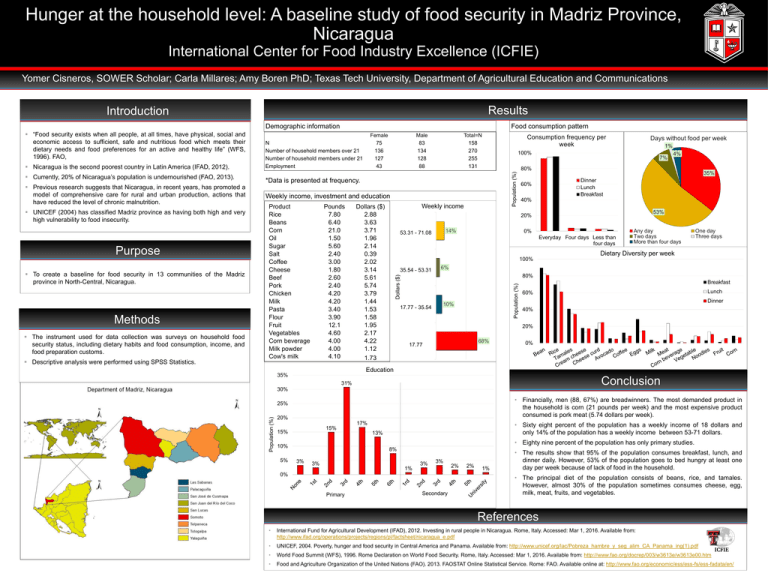
Hunger at the household level: A baseline study of food security in Madriz Province, Nicaragua International Center for Food Industry Excellence (ICFIE) Yomer Cisneros, SOWER Scholar; Carla Millares; Amy Boren PhD; Texas Tech University, Department of Agricultural Education and Communications Results Introduction Demographic information UNICEF (2004) has classified Madriz province as having both high and very high vulnerability to food insecurity. Purpose To create a baseline for food security in 13 communities of the Madriz province in North-Central, Nicaragua. Methods The instrument used for data collection was surveys on household food security status, including dietary habits and food consumption, income, and food preparation customs. Descriptive analysis were performed using SPSS Statistics. *Data is presented at frequency. Weekly income, investment and education Product Rice Beans Corn Oil Sugar Salt Coffee Cheese Beef Pork Chicken Milk Pasta Flour Fruit Vegetables Corn beverage Milk powder Cow's milk Pounds 7.80 6.40 21.0 1.50 5.60 2.40 3.00 1.80 2.60 2.40 4.20 4.20 3.40 3.90 12.1 4.60 4.00 4.00 4.10 Dollars ($) 2.88 3.63 3.71 1.96 2.14 0.39 2.02 3.14 5.61 5.74 3.79 1.44 1.53 1.58 1.95 2.17 4.22 1.12 1.73 Consumption frequency per week Weekly income 1% 7% 80% 60% 35% Dinner Lunch Breakfast 40% 53% 20% C$1501 53.31C$2000 - 71.08 4% 14% 0% Everyday Four days Less than four days Any day Two days More than four days One day Three days Dietary Diversity per week 100% C$1001 35.54C$1500 - 53.31 6% 80% C$501 - C$1000 17.77 - 35.54 10% Breakfast Lunch 60% Dinner 40% 20% C$500.00 17.77 68% 0% Education 35% Conclusion 31% 30% • Financially, men (88, 67%) are breadwinners. The most demanded product in the household is corn (21 pounds per week) and the most expensive product consumed is pork meat (5.74 dollars per week). 25% 20% 15% 15% 17% • Sixty eight percent of the population has a weekly income of 18 dollars and only 14% of the population has a weekly income between 53-71 dollars. 13% • Eighty nine percent of the population has only primary studies. 10% 5% Days without food per week 100% Population (%) Previous research suggests that Nicaragua, in recent years, has promoted a model of comprehensive care for rural and urban production, actions that have reduced the level of chronic malnutrition. Total=N 158 270 255 131 Population (%) Currently, 20% of Nicaragua’s population is undernourished (FAO, 2013). Male 83 134 128 88 Dollars ($) Nicaragua is the second poorest country in Latin America (IFAD, 2012). Female 75 136 127 43 N Number of household members over 21 Number of household members under 21 Employment Population (%) “Food security exists when all people, at all times, have physical, social and economic access to sufficient, safe and nutritious food which meets their dietary needs and food preferences for an active and healthy life” (WFS, 1996). FAO, Food consumption pattern 8% 3% 3% 1% 3% 3% 0% Primary Secondary 2% 2% 1% • The results show that 95% of the population consumes breakfast, lunch, and dinner daily. However, 53% of the population goes to bed hungry at least one day per week because of lack of food in the household. • The principal diet of the population consists of beans, rice, and tamales. However, almost 30% of the population sometimes consumes cheese, egg, milk, meat, fruits, and vegetables. References • International Fund for Agricultural Development (IFAD), 2012. Investing in rural people in Nicaragua. Rome, Italy. Accessed: Mar 1, 2016. Available from: http://www.ifad.org/operations/projects/regions/pl/factsheet/nicaragua_e.pdf • UNICEF, 2004. Poverty, hunger and food security in Central America and Panama. Available from: http://www.unicef.org/lac/Pobreza_hambre_y_seg_alim_CA_Panama_ing(1).pdf • World Food Summit (WFS), 1996. Rome Declaration on World Food Security. Rome, Italy. Accessed: Mar 1, 2016. Available from: http://www.fao.org/docrep/003/w3613e/w3613e00.htm • Food and Agriculture Organization of the United Nations (FAO). 2013. FAOSTAT Online Statistical Service. Rome: FAO. Available online at: http://www.fao.org/economic/ess/ess-fs/ess-fadata/en/


