Section 1.1, An Overview of Statistics 1 Definitions and Terminology
advertisement
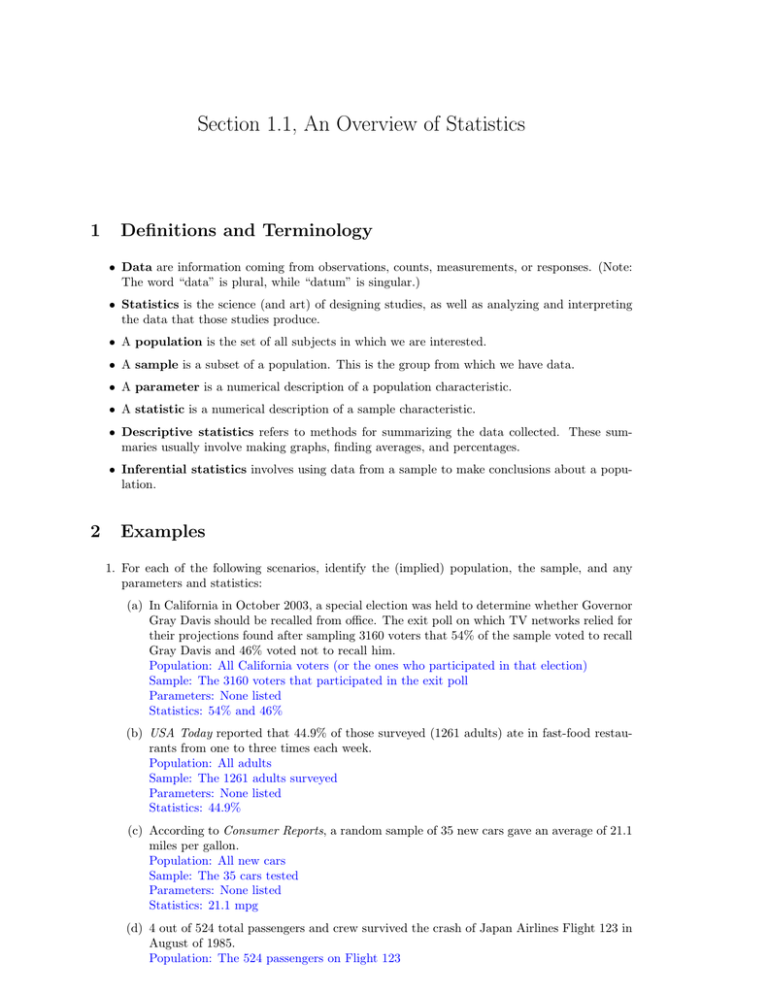
Section 1.1, An Overview of Statistics 1 Definitions and Terminology • Data are information coming from observations, counts, measurements, or responses. (Note: The word “data” is plural, while “datum” is singular.) • Statistics is the science (and art) of designing studies, as well as analyzing and interpreting the data that those studies produce. • A population is the set of all subjects in which we are interested. • A sample is a subset of a population. This is the group from which we have data. • A parameter is a numerical description of a population characteristic. • A statistic is a numerical description of a sample characteristic. • Descriptive statistics refers to methods for summarizing the data collected. These summaries usually involve making graphs, finding averages, and percentages. • Inferential statistics involves using data from a sample to make conclusions about a population. 2 Examples 1. For each of the following scenarios, identify the (implied) population, the sample, and any parameters and statistics: (a) In California in October 2003, a special election was held to determine whether Governor Gray Davis should be recalled from office. The exit poll on which TV networks relied for their projections found after sampling 3160 voters that 54% of the sample voted to recall Gray Davis and 46% voted not to recall him. Population: All California voters (or the ones who participated in that election) Sample: The 3160 voters that participated in the exit poll Parameters: None listed Statistics: 54% and 46% (b) USA Today reported that 44.9% of those surveyed (1261 adults) ate in fast-food restaurants from one to three times each week. Population: All adults Sample: The 1261 adults surveyed Parameters: None listed Statistics: 44.9% (c) According to Consumer Reports, a random sample of 35 new cars gave an average of 21.1 miles per gallon. Population: All new cars Sample: The 35 cars tested Parameters: None listed Statistics: 21.1 mpg (d) 4 out of 524 total passengers and crew survived the crash of Japan Airlines Flight 123 in August of 1985. Population: The 524 passengers on Flight 123 Sample: Same as the population Parameters: 4 survivors Statistics: Same as the parameter 2. For each of the following scenarios, identify the description and the inference: (a) The Current Population Survey (CPS) is a monthly survey of households conducted by the U.S. Census Bureau for the Bureau of Labor Statistics. It provides a comprehensive body of data on the labor force, employment, and unemployment. A CPS of about 60,000 households indicated that of those households, 8.0% of the whites, 23.4% of the blacks, and 22.7% of the Hispanics had annual income below the poverty level. Using these data, a statistical method makes the prediction that the percentage of all black households in the United States that had income below the poverty level was at least 22% but no greater than 25%. Description: “8.0% of the whites, 23.4% of the blacks, and 22.7% of the Hispanics had annual income below the poverty level.” Inference: ”The percentage of all black households in the United States that had income below the poverty level was at least 22% but no greater than 25%.” (b) During the past 2 years, every time that Julia ran 2 miles, she recorded her run time. Her average time for these 90 runs was 15.6 minutes. Using a statistical method, she concludes that her exact average time for running 2 miles is between 15.23 and 15.97 minutes. Description: “Her average time ... was 15.6 minutes.” Inference: “Her exact average time for running 2 miles is between 15.23 and 15.97 minutes.”
