Applied Statistics Practice Midterm 2 Exam

Applied Statistics Practice Midterm 2 Exam
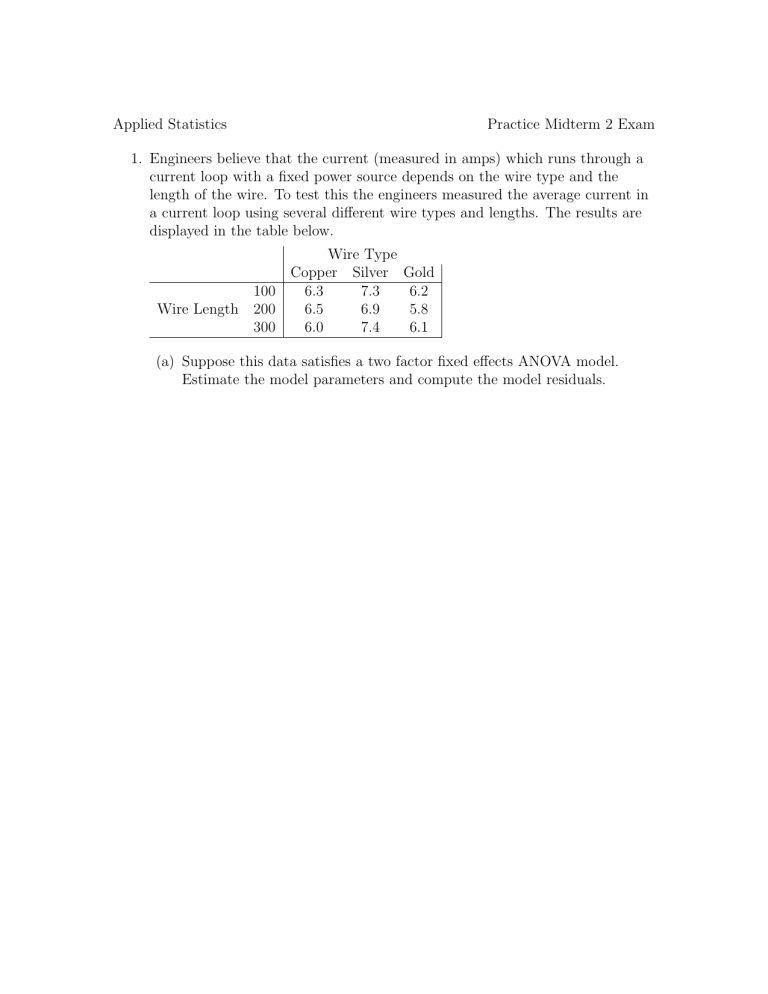
1. Engineers believe that the current (measured in amps) which runs through a current loop with a fixed power source depends on the wire type and the length of the wire. To test this the engineers measured the average current in a current loop using several different wire types and lengths. The results are displayed in the table below.
100
Wire Length 200
300
Wire Type
Copper Silver Gold
6.3
6.5
6.0
7.3
6.9
7.4
6.2
5.8
6.1
(a) Suppose this data satisfies a two factor fixed effects ANOVA model.
Estimate the model parameters and compute the model residuals.
(b) Test at level α = .
05 whether there are any significant effects due to either the wire type or the wire length.
2. Entomologists believe that there is a relationship between the amount of pollen a honey bee takes from a flower as it is collecting nectar and the amount of moisture in the air (humidity). To study this relationship, 15 honeybees were allowed to collect nectar from flowers at various air humidity levels and the amount of pollen they collected was weighed. The humidity was measured as a percentage and the pollen was measured in µg (micrograms).
Humidity 12.3
35.3
32.6
28.6
37.0
35.9
20.0
39.4
Pollen Weight 226.8
173.0
178.0
190.1
179.1
180.8
205.9
172.5
Humidity 59.3
26.7
42.6
28.5
29.8
70.7
23.5
Pollen Weight 134.1
200.9
160.6
189.0
187.6
106.3
200.2
(a) Perform a test at level α = .
05 to determine whether or not the correlation between Humidity and Pollen Weight is non-zero. Make sure to explain whether or not the hypotheses of the test you used are satisfied.
(b) Let Y denote the pollen weight and X denote the air humidity. Using least squares, estimate the parameters model
Y = β
0
β
0 and
+ β
1
X + ,
β
1 in the simple linear where is a mean zero normally distributed error.
(c) Suppose we specify in the model above that i
∼ N (0 , σ
2
). In this case is the model appropriate for the given data? Check all aspects of the model’s adequacy.
(d) The researchers believe that if the air humidity increases by 1%, then the average amount of pollen a honey bee will take from a flower is reduced by 25 µg . Using this data, perform a test of size α = .
05 to check this claim.
(e) If the air humidity is 30%, what do you predict for the average weight of pollen a honey bee can take from a flower? Derive a 99% confidence interval for this average.
(f) If the air humidity is 30%, derive a 99% prediction interval for the weight of pollen a honey bee can take from a flower at this humidity level.

