PERSISTENT SUBSIDIES IN FISHING: HOW WILL A FUEL PRICE INCREASE
advertisement
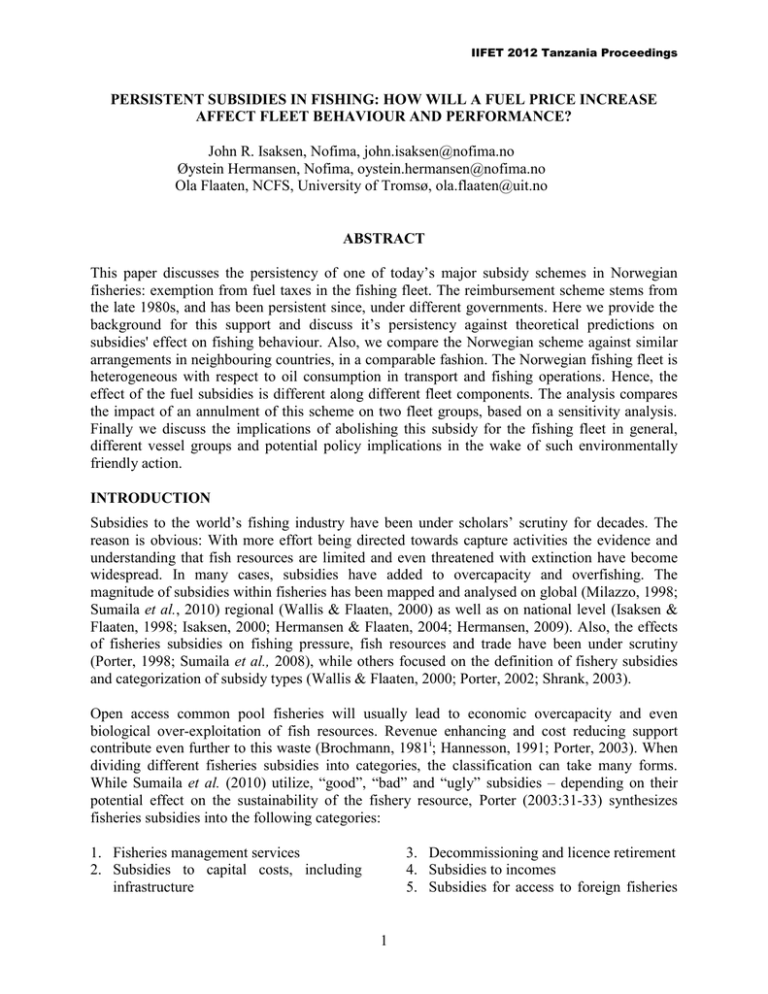
IIFET 2012 Tanzania Proceedings PERSISTENT SUBSIDIES IN FISHING: HOW WILL A FUEL PRICE INCREASE AFFECT FLEET BEHAVIOUR AND PERFORMANCE? John R. Isaksen, Nofima, john.isaksen@nofima.no Øystein Hermansen, Nofima, oystein.hermansen@nofima.no Ola Flaaten, NCFS, University of Tromsø, ola.flaaten@uit.no ABSTRACT This paper discusses the persistency of one of today’s major subsidy schemes in Norwegian fisheries: exemption from fuel taxes in the fishing fleet. The reimbursement scheme stems from the late 1980s, and has been persistent since, under different governments. Here we provide the background for this support and discuss it’s persistency against theoretical predictions on subsidies' effect on fishing behaviour. Also, we compare the Norwegian scheme against similar arrangements in neighbouring countries, in a comparable fashion. The Norwegian fishing fleet is heterogeneous with respect to oil consumption in transport and fishing operations. Hence, the effect of the fuel subsidies is different along different fleet components. The analysis compares the impact of an annulment of this scheme on two fleet groups, based on a sensitivity analysis. Finally we discuss the implications of abolishing this subsidy for the fishing fleet in general, different vessel groups and potential policy implications in the wake of such environmentally friendly action. INTRODUCTION Subsidies to the world’s fishing industry have been under scholars’ scrutiny for decades. The reason is obvious: With more effort being directed towards capture activities the evidence and understanding that fish resources are limited and even threatened with extinction have become widespread. In many cases, subsidies have added to overcapacity and overfishing. The magnitude of subsidies within fisheries has been mapped and analysed on global (Milazzo, 1998; Sumaila et al., 2010) regional (Wallis & Flaaten, 2000) as well as on national level (Isaksen & Flaaten, 1998; Isaksen, 2000; Hermansen & Flaaten, 2004; Hermansen, 2009). Also, the effects of fisheries subsidies on fishing pressure, fish resources and trade have been under scrutiny (Porter, 1998; Sumaila et al., 2008), while others focused on the definition of fishery subsidies and categorization of subsidy types (Wallis & Flaaten, 2000; Porter, 2002; Shrank, 2003). Open access common pool fisheries will usually lead to economic overcapacity and even biological over-exploitation of fish resources. Revenue enhancing and cost reducing support contribute even further to this waste (Brochmann, 1981i; Hannesson, 1991; Porter, 2003). When dividing different fisheries subsidies into categories, the classification can take many forms. While Sumaila et al. (2010) utilize, “good”, “bad” and “ugly” subsidies – depending on their potential effect on the sustainability of the fishery resource, Porter (2003:31-33) synthesizes fisheries subsidies into the following categories: 1. Fisheries management services 2. Subsidies to capital costs, including infrastructure 3. Decommissioning and licence retirement 4. Subsidies to incomes 5. Subsidies for access to foreign fisheries 1 IIFET 2012 Tanzania Proceedings Within these categories, fuel subsidies or other subsidies that makes intermediate inputs cheaper have no place. Sumaila et al. (2010) estimated world-wide fisheries subsidies in 2003 to be in the range of US$ 25–29 billion, where fuel subsidies compose about 15–30 per cent; whereas capacity enhancing subsidies compose the lion’s share, about 60 per cent. Fuel subsidies and tax preferences make fishing operations cheaper and encourage vessel owners to invest in stronger, more fuel intensive engines – which allow a greater range of operation and larger catches (Porter 2002). Norway has a long history of providing assistance to the fishing industry. As put forward by Milazzo (1998: 23): “Norway has provided financial assistance to its fishing industry for more than 30 years. Since 1964, the government has negotiated annually an assistance package with the Norwegian Fishermen’s Association, with the overall objective of raising average fishermen’s incomes to level of industrial workers. Not surprisingly, though, these agreements on financial assistance soon lost sight of their original, short-term objectives, and effectively became ongoing subsidies that industry came to expect each year as a matter of course.” Total transfers to the Norwegian fishing industry added up to a considerable share of catch value, peaking in 1981 with more than 30 per cent. However, from 1990, fisheries subsidies were to a large degree phased out, and fell from a 20 per cent share of catch value to less than five per cent within a four year period (Flaaten & Isaksen, 1998). Hannesson (1996: 22-3) shows anecdotally how the subsidization of the fishing industry in Norway was highly correlated with the price of crude oil in the period from 1974 to 1994. In 2004 the Government stopped the annual negotiations with the Fishermen’s Association on financial support. Since then, support to the fishing industry has been modest. Figure 1 (a) shows the peak in fisheries subsidies, as defined by the authorities, in the early 1980s and the rapid decline since then. From Figure 1 (b) we see that the fall in subsidies coincides with a rapid increase in catch per fisherman, as both number of fishermen and fishing vessels are drastically reduced. Figure 1 (a), however, do not include the subsidy element we are interested in – the fuel tax reimbursement scheme, since Norwegian authorities take a more cautious definition of subsidies than the WTO “Subsidies and Countervailing Measures” agreement. a) b) Figure 1. a) Subsidies to the Norwegian fishing industry, 1960–2010 (bill NOK, nominal value) b) catch (right axis), fishermen and catch per fisherman (left axis – all in tons) 1945– 2010. Source: Directorate of Fisheries 2 IIFET 2012 Tanzania Proceedings In the WTO framework (WTO, 2009), financial contributions not only include direct transfer of funds, but also revenue forgone by the authorities, provision of goods or services and purchase of goods. According to the WTO, subsidies are further divided in two categories; prohibited and actionable. Export subsidies and subsidies favouring local content are prohibited. Using the WTO-definition of subsidies, the Norwegian fishing industry is directly supported by mNOK 72, while general services and tax exemptions add up to bNOK 2.21 in 2008. The main direct support items are transportation support (49 per cent) and support to the seal harvest (16 per cent). Of the indirect support items, the coast guard (22 per cent), income and CO2-tax exemption (both 16 per cent) and research support (14 per cent) takes the lion’s share. In the next section we’ll take a closer look at the fuel tax exemption scheme. We focus on the Norwegian fuel subsidies – the exemption of fuel taxes for fishing vessels – a scheme which has been in effect since 1988. Our research problem is four-folded: First, we describe the Norwegian mineral oil tax reimbursement scheme and its history and place it within the classification scheme of fisheries subsidies. Second, we portray this specific industry support with respect to the industry development. Third, we analyse the effect of a possible annulment of this support, and, finally, we discuss and conclude our findings with respect to industry impact and policy implication. The paper is organized as follows. The next section provides the background for our analysis. Then we account for the mineral oil taxation scheme and data, before discussing the method and results. Finally, we discuss our findings and their implication for the industry and policy makers. NORWEGIAN FUEL TAX EXEMPTIONS AND DATA From 1970, Norwegian enterprises and consumers were taxed for their use of fuel oil, primarily to reduce environmentally harmful emissions. However, from the start registered fishing vessels were exempted from the most important fuel taxes. This is the case also for some other industries. The taxation scheme has been modified and presently purchase of fuel is levied with CO2, SO2 and NOx taxes. In 2008, the CO2 tax rate was 1.395 NOK/litre. The SO2 tax is progressive and charges 0.072 NOK/l for each commenced 0.25 per cent sulphur in the fuel (weight basis). NOX is taxed based on calculated emissions; the rate in 2008 being 15.39 NOK/kg NOX. To some degree fisheries are exempted from these taxes. In terms of the CO2 tax, all fisheries are exempted, while only distant water fisheries (further than 250 nautical miles from the coast) are exempted from the SO2 taxii. In practice, vessels buy taxed fuel and are reimbursed the CO2 tax from a government agency. When heading for distant water fisheries, vessels purchase untaxed fuel directly. The most complicated regime is found for the NOX tax. Fishing vessels with less than 750 kW engine power are totally exempted. An agreement on reduction of emissions was signed by the authorities and several industry organizations. Instead of paying the full tax rate, vessels (both fishing vessels and others) that entered into this agreement pay a reduced rate of 4.0 NOK/kg NOX. Tax revenues go to a fund that financially supports investments in emission reducing measures aboard vessels. 3 IIFET 2012 Tanzania Proceedings Detailed data for individual vessels were obtained from The Guarantee Fund for Fishermen (GfF), which has administered the reimbursement scheme since its introduction. In a special data set, we had information for every vessel that were granted fuel tax reimbursement in the period 2000–2007, from which aggregated annual figures over reimbursed volume and value could be estimated. In addition, we were granted access to the data behind the annual profitability study for the fishing fleet from the Directorate of Fisheries (Anon. 2008). From there, cost- and income data, together with catch and operational data, could be obtained for individual vessels, as well as average values for vessel groups. This source, however, represents only a sample of vessels and not the whole population where the selection criterion is mainly the importance of the vessel with respect to first hand sales value. From a total of 1 709 whole year operated vessels, data for 624 vessels were collected and compared (37 per cent). For some vessel groups, with rather low catch value, the sample size’s share of the population is rather small (for example for coastal vessels less than 10 meters it was only 16 per cent), while for larger vessels it is usually in the range of 60–95 per cent. The main reason for the differences in relative sample size is that the number of vessels in the sub-population is significantly higher for the former than the latter. RESULTS In estimating the value of the total mineral oil tax exemption for the fishing fleet in 2007, shown in Table 1, we have employed a static model, thus not taking into account substitution effects and other adaptations the fishing fleet could have introduced as responses to higher taxes. Official Norwegian statistics on fuel use across industries are not reliable since 2005 (Isaksen and Hermansen, 2009). This study is based on average fuel costs and average fuel prices, and by utilizing the annual profitability survey of Norwegian fishing vessels (Directorate of Fisheries, 2008), the estimate of the actual fuel consumption of the Norwegian fishing fleet in 2007 is 362 million litres. Of this, 244 million litres (2/3) fall in under, and is accounted for, in the reimbursement scheme, while the rest, 118 mill litres, is the estimated consumption of Norwegian vessels operating in distant waters – from “tax free” bunkering in Norway, at sea in international waters or abroad (Isaksen and Hermansen, 2009). An estimate of the foregone CO2 tax is obtained by multiplying consumption with tax rate. In 2007, GfF reimbursed fish vessel owners a total of mNOK 236 of CO2-tax. The rest stems from fuel consumption exempted from CO2 taxation. To estimate foregone SO2 tax is more complicated, as the coastal fisheries pay this tax, but data on consumption in distant water fisheries’ are not available. Therefore the latter is estimated from data on reimbursed amount, assuming all other use is in distant waters. We also assume that all fuel contains less than 0.25 % sulphur, since heavy fuels rarely are used in the fishing fleet. The exempted NOX tax in 2007 is estimated to mNOK 327 using a rate of 0.9 NOK per litre fuel. Table 1. Estimated exempted mineral oil taxes in the Norwegian fishing fleet, 2007. Tax Value (mNOK) CO2 352 SO2 8 4 NOX 327 Total 687 IIFET 2012 Tanzania Proceedings From an economic (and environmental) point of view, the optimal emission tax on CO2 should be equal across countries and sectors since the marginal damage is independent of the location of the emission source (Bye & Bruvoll 2008). From the “polluter pay” principle either taxes or emission rights should be utilised. However, CO2 taxes vary between countries, as well as within national economic sectors and across fuel types (op. cit). The same applies to SO2, NOx and other environmental taxes. When considering the subsidy element of the CO2-tax reimbursement/exemption the contribution should be determined on market prices (see a recent WTO ruling; WTO, 2009??). In the EU quota market for CO2 emissions, the price per ton varied between 124 and 235 NOK (€ 13.55– 29.40) in 2008 (Isaksen and Hermansen, 2009). The tax in Norway in 2008 (NOK 1,395 per litre oil) corresponds to a rate of 528 NOK per ton CO2 emissions, which indicates a tax approximately two to four times as high as the market price of CO2. The exemption from the CO2 tax for the fishing fleet operating in coastal waters was introduced in 1988, due to the difficult economic situation in the industry. At that time the tax amounted to 0.21 NOK/litre oil, and it has increased to 1.599 NOK/litre today (2012). In Figure 2, the average operating margin in the Norwegian fishing fleet is portrayed. It should, however, be noted that the average operating margin hides huge variations between different vessel groups. In 2010 it varied from -1.5 per cent (pelagic coastal vessels under 11 metres) to 27.8 per cent (large purse seiners). As will be discussed below the rationale for supporting the fishing industry has dwindled since the late 1980s. Operating margin (%) 20 15 10 5 2010 2008 2006 2004 2002 2000 1998 1996 1994 1992 1990 1988 1986 1984 1982 1980 0 Figure 2. Average operating margin (EBIT’s share of turnover) in the Norwegian fishing fleet, 1980–2010. Source: Directorate of Fisheries At hand for evaluating subsidies within fisheries is the well-developed bioeconomic analysis. Theory, together with empirical evidence, demonstrates that fish resources, left un-regulated with free access usually will lead to over-exploitation and dissipation of resource rent (Hannesson, 1991; Flaaten, 2011). Simple bioeconomic models usually do not portray the heterogeneity of vessels and fisheries, but nevertheless give an informative and clear view of how subsidies distort the industry. Revenue enhancing and cost reducing support contribute even further to the free access waste, by augmenting effort and reducing fish stocks (Brochmann, 1981; Hannesson, 1991; Porter, 2003). However, the biological effects from subsidies are different when property rights and good management systems are in place, which mainly is the case in Norwegian fisheries. 5 IIFET 2012 Tanzania Proceedings We analyze how cancelling the fuel tax exemptions will affect the economic performance of two different vessel groups in the Norwegian fishing fleet, and discuss possible implications for management and industry from such a policy reform. Profitability change from a fuel price increase is analysed by way of a sensitivity analysis. The profitability survey’s cost and earnings data is the basis, and by changing the fuel cost item (and the labour cost accordinglyiii) we find the fuel cost increase necessary for a “break even” result (EBIT=0), assuming that there are no effects on harvest- and stock dependent costs. Thus this is a short run bioeconomic analysis. In order to add “practitioners’ wisdom and experience” to the desk study, we address vessel owners in some vessel groups – ranging from the smallest to the largest – with telephone interviews, asking them what consequences different fuel price increases would mean to their fishing operations and operational decisions. Interviews were carried out in December 2008, where prices were back to “normal” half a year after a considerable price shock (30 per cent) on marine gas oil, and we avoided questions addressing a tax increase directly in order not to get “politicized” answers. The two vessel groups analysed are very different: The first consists of smaller coastal vessels (10–15 meters) targeting demersal species, while the second is the large purse seiners which fish for pelagic species. The former is the most numerous group in the Norwegian fishing fleet, with 686 vessels (40 per cent of the total number of whole-year operated vessels in 2007, and the latter is the 45 purse seiners with the additional blue whiting trawl license, which catch constituted 36 per cent of the total Norwegian catch that year. For the coastal vessels cod is the most important species, amounting to 39 and 56 per cent of total catch volume and value, respectively, while for the purse seiners (vessels of 50–90 meters length) in 2007 the herring volume and value constituted 38 and 43 per cent, respectively, of the total catch of this vessel group. Both groups have that in common that they are very fuel efficient in their fishing operation, compared to other vessel groups (Ellingsen & Lønseth, 2005; Schau et al., 2009). Through the lay system, the crew on the coastal vessels bears some of the increased fuel costs. On the other hand, the off-shore vessels can bunker tax free when fishing in distant waters. Thus, the fuel cost increase they incur is less than the cost increase the coastal fleet experience. Coastal vessels, based on 2007 data, would experience a fuel cost increase in the range of 19–24 per cent, while off-shore vessels would only see an increase of 15 per cent. The off-shore vessels’ estimated EBIT is reduced by 15 per cent, whereas the effect for the coastal vessels is between 5 and 12 per cent. This coarse analysis shows that, on average, the effect from annulling the reimbursement scheme is detrimental, but relatively modest. Annulling the scheme would not render the Norwegian fishing fleet unprofitable. Fuel is utilized to different degrees across Norwegian fishing vessels. While in some fisheries it constitutes only a small part of the total costs, it is substantial in others, usually gear and size dependent. In 2007, fuel costs constituted on average 24 per cent of the total costs (crew remuneration excluded) in the fleet. However, in the coastal fleet (<28m) the share was 15 per cent, while 28 per cent for the off-shore fleet (>28m). A more fine grained analysis reveals that the fuel cost share of total costs vary between 11 and 33 per cent. Another dimension is that the price demanded for fuel differs with the size of the vessels, and rather large rebates are conceded to larger vessels and high consumption. According to the figures from GfF, larger vessels 6 IIFET 2012 Tanzania Proceedings (>28m) on average paid an oil price 20 per cent lower than the smallest vessels (<8m) in 2007. On the other hand, most of the reimbursement of mineral oil tax goes to the largest vessels. In 2007 roughly 4 000 vessels were reimbursed the mineral oil tax, as shown in Figure 3a; 242 large vessels (6 per cent) received 71 per cent of the mNOK 246 reimbursement. In fact, six offshore vessels covered the same amount of reimbursed fuel as the 1 545 vessels below 10 meters. Hence, vessels less than 28 meters (94 per cent) received only 29 per cent of the sum in 2007. Recalling that larger vessels pay a lower fuel price and are, to some degree, able to refuel taxfree (abroad or domestically??), the support from the reimbursement/exemption constitute a greater share of their fuel price than in the case of smaller vessels paying higher prices. Figure 3b reveals the development in the nominal fuel price and the mineral oil tax in 1999–2012. a b Figure 3. Distribution of fuel tax reimbursement by vessel size (left) in 2007, and MGO price and tax development, 1999–2012 (right). Source: GfF, Statoil The fuel cost increases which would render the average vessel going break-even (EBIT=0) are shown in Figure 4 for twelve vessel groups; with averages for the four years 2004–2007 in order to smooth out annually shocks. There is a huge variation in the results. For shrimp and saithe trawlers, with a negative operation profit, a fuel price reduction is needed to achieve break-even. Trawlers – in general – are sensitive to a fuel price increase, whereas coastal vessels and purse seiners could endure a 200–350 per cent fuel price increase. Note that these are vessel group means and that individual vessels’ performance can deviate substantially. Furthermore, being a static analysis, implicitly it has been assumed that the vessel groups – on average – would generate the same revenues and costs in the same manner under a fuel price increase as was the case for the 2004–2007 average. This is a relatively strong assumption since vessel owners, under the influence or even expectations of fuel price increases, would act in order to mitigate such cost increases. Such adaptation strategies, both in the short and longer term, and especially for the two vessel groups under scrutiny, will be discussed in greater details beneath. 7 IIFET 2012 Tanzania Proceedings Figure 4. Fuel price increase “safety margin” for vessel groups with respect to fuel price (increase needed for “break-even” result), mean for 2004–2007. (Abbrevations: Pel.=pelagic, PS=purse seine, BW=blue whiting trawl license, CV=coastal vessels) DISCUSSION The analysis has demonstrated that the mineral oil tax exemptions are not a prerequisite for a profitable Norwegian fishing fleet. Of the population of 1700 whole year operated vessels, only two out of 18 vessel groups – representing about 15 vessels – had deficits for the period 2004– 2007. And the development in profitability after 2007 (according to Figure 2) should not set off any alarm bells in that respect either. In an almost Parliament-wide compromise as a measure to promote more climate friendly conduct, a proposal was set forth to consider phasing out the fishing industry’s fuel tax exemptions. At the present point of time (2012), however, the reimbursement scheme is still in effect. The importance of the subsidy elements of the Norwegian tax exemptions depend to a large extent of the perspective. The fish industry is to a large extent export oriented - thus in competition with fish from other countries and food sources. A survey of the fuel tax regimes in our neighbouring coastal states shows that none of their fleets are charged taxes on fuel (see Isaksen & Hermansen, 2009). Compared to this, the Norwegian regime implies no subsidies. Compared with other Norwegian industries the picture gets more complicated. Some industries, like airline, shipping and oil production, are totally exempted, as in most countries. Others, e.g. wood and fishmeal processing industries, pay half tax on their fuel consumption. Employing this perspective, there is an element of subsidies, but the amount is difficult to estimate, due to the tax rate differences. The fishing fleet can to some degree adapt to increased fuel prices. However, a political proposal on taxation would for sure be met with lobbyism against such measures. As underlined by one of the respondents when asked how an annulment would affect his adjustment: “… one possible response would be to drop 100 tons of herring outside the Parliament!” Even if the probability 8 IIFET 2012 Tanzania Proceedings of such actions may be low, one should not underestimate stakeholders’ will to retain granted rights. Another dimension of this is the ability of the upstream link in the seafood value chain to shift the burden from this tax over to the consecutive downstream links, i.e. the fish processors. This will depend on the competitive conditions in the market (Bendiksen 2008). In Norway, fishermen’s organizations have considerable market power in the first hand market for fish, which could vouch for a shift of the duty to adjacent stages in the value chain. Do fishing vessels have possibilities for substituting away from marine gas oil? In the short run the way to adapt to increased fuel prices is to alter the way of operating the vessel, by minimizing the steaming between port and fishing ground and by reducing the speed. Vessels may concentrate fishing activities to periods and areas where the fish abundance is high, and greater load before going to port. Fisheries with marginal profitability might be rendered unprofitable and phased out. In the longer run, a substantial and persistent fuel price increase would induce increased adjustment possibilities, such as more energy efficient fishing vessels and gear and shift of quota rights from less to more energy inefficient gear, if allowed. For the smaller coastal vessels an annulment of the reimbursement scheme would be relatively small. Oil constitutes a relatively low cost for these vessels, and they have limited possibilities for substitution. Oil price increase effects in this vessel group could either be to withdraw from fishing for lower valued species (especially saithe, but also haddock) and from fishing from distant ports (i.e. spring cod fishery in Finnmark). All in all, however, the operational effect in this group would probably be marginal. For purse seiners with the additional trawl license for blue whiting, the adjustment possibilities are greater than for the smaller coastal vessels. The most likely adaptations would be to phase out fisheries with little and uncertain profitability, such as the North Sea herring with limited quotas, and the horse mackerel fishery. For the blue whiting fishery west of Ireland and the capelin fishery in the Icelandic zone fishing could either be phased out or deliveries would be done in Ireland/Iceland in order to reduce steaming. For other vessel groups the economic effect could be more substantial, especially to those at the left in Figure 4. In case of a reimbursement scheme annulment the landing-abroad effect would be greater and may take place in all fisheries, since vessels then could take an advantage of lower fuel prices abroad. Refueling at the open sea from foreign tanker vessels may also be an option, especially for larger fishing vessels (Isaksen and Hermansen, 2009). The rationale behind environmental taxation is to reduce emissions harming the global climate and the local environmental conditions. For some fisheries and vessel groups, the chosen adaptations may result in higher emissions in order to avoid taxed fuel, which clearly is counterproductive. In addition, in case of comparatively high Norwegian fuel prices in the future, vessels would deliver their fish abroad, and hence reduce the supply to the Norwegian fish processing industry. The substantiated or potential effects from taxation constitute important information for policy makers. Undoubtedly this scheme is an industry support that should be abolished, especially since the worst emitters get the highest relief from it. However, removing this support would, according to our analysis, spur incentives and responses in the fleet that could bring about 9 IIFET 2012 Tanzania Proceedings unfavorable consequences, especially shift in demand towards foreign “un-taxed” fuel and a shift in supply of fish towards landings abroad. Some distributional effects also come into place since smaller energy effective vessels have considerably less opportunities to avoiding the tax. A good solution to protect the environment from GHG emissions from the fishing fleet calls for an international harmonization of fuel taxes among nations. However, in light of the efforts incurred to achieve international fuel tax agreements for similar industries (i.e. airlines and shipping) the international community does not seem ready for this yet. REFERENCES Anon., 2008. Lønnsomhetsundersøkelsen for fiskeflåten 2007 (In Norwegian: The fishing fleet profitability study 2007). Fiskeridirektoratet, Bergen. Bendiksen, BI, 2008. Hvem bærer byrden av skatter og avgifter i fiskerinæringen? (in Norwegian: Who carries the burden of taxes and duties in the fisheries industry?) Report no. 5/2008. Nofima, Tromø Brochmann, B, 1981. Virkninger på lang sikt av statsstøtte til fiskeriene (“On the long run effects of government transfers to the fishing industry” in Norwegian), Sosialokønomen no.2. Bye, T and A Bruvoll, 2008. Taxing energy – why and how? The present policies across western countries. Report 8/28. Statistics Norway, Oslo. Flaaten, O. (2011). Fisheries economics and management. The Norwegian College of Fishery Science, University of Tromsø, Tromsø (pp. 1-170), ISBN 978-82-8266-026-6 http://www.maremacentre.com/bioeconomics Hannesson, R, 1996, Fisheries Mismanagement: The case of the North Atlantic Cod. Fisheries New Books, Blackwell, London Hannesson, R, 1991. Economic Support of the Fishing Industry: Effects on Efficiency and Trade. Report for OECD, Directorate of Food, Agriculture and Fisheries, Committee for Fisheries. AGR/FI/EG(91)1, 20 p. Hermansen, Ø and JR Isaksen, 2008, Føringstilskudd i fiskerinæringen – kartlegging og evaluering (in Norwegian: Transport support in Norwegian fisheries). Rapport 10/2008, Nofima Marked, Tromsø Hermansen, Ø and O Flaaten, 2004, Government financial transfers to the fish harvesting, processing and aquaculture industries – Norway 1990 – 2002. Rapport nr SF 09, Norut Samfunnsforskning AS, Tromsø Ellingsen, H and M. Lønseth, 2005, Energireduserende tiltak innen norsk fiskeri (in Norwegian; Energy reducing efforts in the Norwegian fishing industry). Report SFH80-A083021, SINTEF Fiskeri og havbruk, Trondheim Flaaten, O and JR Isaksen, 1998, Governmental financial transfers to the Norwegian fishing industry, økonomisk Fiskeriforskning, 8(1): 73-87. Isaksen, JR and Ø Hermansen, 2009, Refusjon av CO2- og grunnavgift i fiskeflåten. Hvor stor betydning har ordningen – og for hvem? (in Norwegian: The mineral oil tax reimbursement scheme in the fishing fleet.) Rapport 9/2009, Nofima Market, Tromsø 10 IIFET 2012 Tanzania Proceedings Isaksen, JR., 2000, Subsidies to the Norwegian Fishing Industry: An Update, Report 13/2000, Fiskeriforskning, Tromsø Milazzo, M, 1998, Subsidies in World Fisheries: A Reexamination, Technical paper 408, Fisheries Series, The World Bank: New York Porter, G, 1998, Fisheries Subsidies, Overfishing and Trade. Fisheries and Trade no. 16. UNEP, Geneva Porter, G, 2002, Fisheries Subsidies and Overfishing. Towards a Structured Discussion. UNEP, Geneva Schau, EM, H Ellingsen, A Endal and S Aanondsen, 2009, “Energy consumption in Norwegian fisheries”, Journal of Cleaner Production, 17(3), 325–34. Schrank, WE, 2003. Introducing Fisheries Subsidies. FAO Technical Paper 437. FAO, Rome, It. Statoil (20??). Pers. com. Steinshamn, SI, 2008. En oversikt og vurdering av skatter og avgifter i fiskeflåten (in Norwegian: An overview and evaluation of taxes and duties in the fishing fleet). SNFreport no. 13/08. SNF, Bergen Sumaila, UR, AS Kahn, AJ Dyck, R Watson, G Munro, P Tydemers and D Pauly, 2010, A bottom-up re-estimation of global fisheries subsidies. Journal of Bioeconomics, [DOI 10.1007/s10818-010-9091-8] Sumaila, UR, L Teh, R Watson, P Tyedmers and D Pauly, 2008, Fuel price increase, subsidies, overcapacity, and resource sustainability. ICES Journal of Marine Science, 65: 832–840. Tyedmers, P, R Watson and D Pauly, 2005, Fueling Global Fishing Fleets. Ambio 34(8): 635–38 Wallis, P and O Flaaten, 2000, Government financial transfers to the fishing industries in OECD countries. In: Proceedings from the 10th biennial conference of the International Institute of Fisheries Economics and Trade, Oregon. Oregon State University, Corvallis WTO, 2009, Subsidies and Countervailing Measures Overview. http://www.wto.org/english/tratop_e/scm_e/subs_e.htm, 26th Feb 2009 ENDNOTES i Bjorn Brochmann MSc was in 1980 on leave from the Ministry of Fisheries to the Norwegian College of Fishery Science when writing this article. Later, when back at the Ministry, he argued internally and externally for the abolishment of the fisheries subsidies. The reaction from the industry was fierce, some demanding the Minister to sack Director Brochmann, but without success. Gradually also the industry representatives, led by the powerful Federation of Fishermen, came to understand that subsidies were not sustainable. ii The sulphur tax is only levied on those fishing in coastal/near waters, and no reimbursement is given. Steinshamn (2008) point to the fact that this fleet was responsible of 5 per cent of emissions, but paid about 11 per cent of the total SO2-tax. However, he claims, sulphur emissions are responsible for local – not global – pollution damages, which makes it rational that less mobile vessels are levied this tax, and not those operating in distant waters. iii Labour costs in Norwegian fisheries are normally calculated as a share of revenues minus some vessel costs. In the coastal fleet (vessel permissions less than 28 meters) crew shares are calculated from revenues minus fuel costs, as opposite to the larger off-shore vessels. Coastal vessel owners can therefore “shift” some of the fuel cost increase over to the crew. Hence, fuel price increases’ effect on profitability is smaller in the coastal fleet than in the offshore fleet. 11

