Construct a binomial probability distribution. Notes
advertisement
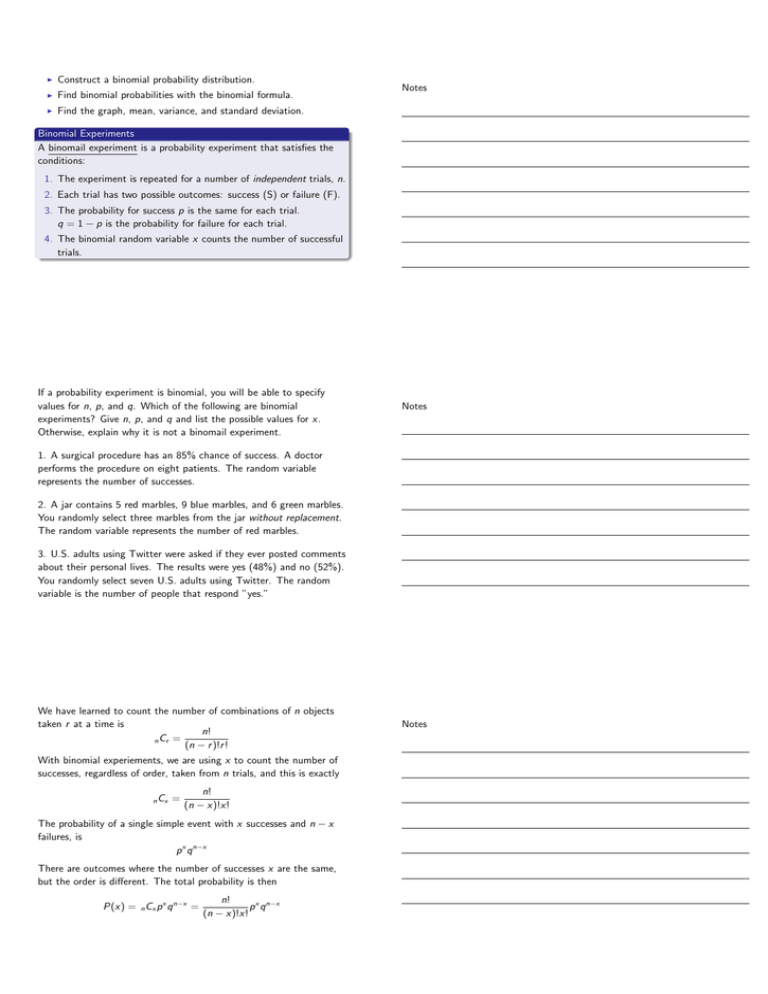
I Construct a binomial probability distribution. I Find binomial probabilities with the binomial formula. I Find the graph, mean, variance, and standard deviation. Notes Binomial Experiments A binomail experiment is a probability experiment that satisfies the conditions: 1. The experiment is repeated for a number of independent trials, n. 2. Each trial has two possible outcomes: success (S) or failure (F). 3. The probability for success p is the same for each trial. q = 1 − p is the probability for failure for each trial. 4. The binomial random variable x counts the number of successful trials. If a probability experiment is binomial, you will be able to specify values for n, p, and q. Which of the following are binomial experiments? Give n, p, and q and list the possible values for x. Otherwise, explain why it is not a binomail experiment. Notes 1. A surgical procedure has an 85% chance of success. A doctor performs the procedure on eight patients. The random variable represents the number of successes. 2. A jar contains 5 red marbles, 9 blue marbles, and 6 green marbles. You randomly select three marbles from the jar without replacement. The random variable represents the number of red marbles. 3. U.S. adults using Twitter were asked if they ever posted comments about their personal lives. The results were yes (48%) and no (52%). You randomly select seven U.S. adults using Twitter. The random variable is the number of people that respond ”yes.” We have learned to count the number of combinations of n objects taken r at a time is n! n Cr = (n − r )!r ! With binomial experiements, we are using x to count the number of successes, regardless of order, taken from n trials, and this is exactly n Cx = n! (n − x)!x! The probability of a single simple event with x successes and n − x failures, is p x q n−x There are outcomes where the number of successes x are the same, but the order is different. The total probability is then P(x) = n Cx p x q n−x = n! p x q n−x (n − x)!x! Notes Example Notes A survey indicates that 41% of women in the United States consider reading their favorite leisure-time activity. You randomly select four U.S. women and ask them if reading is their favorite leisure-time activity. The probability distribution is built through the formula: Using n = 4, p = 0.41, q = 0.59 for x = 0, meaning none of the women responded with yes, the probability is P(x = 0) = 4 C0 (0.41)0 (0.59)4 = 1(0.41)0 (0.59)4 ≈ 0.121 Continuing for x = 1, x = 2, x = 3, x = 4, P(x = 1) = 4 C1 (0.41)1 (0.59)3 = 4(0.41)1 (0.59)3 ≈ 0.337 P(x = 2) = 4 C2 (0.41)2 (0.59)2 = 6(0.41)2 (0.59)2 ≈ 0.351 P(x = 3) = 4 C3 (0.41)3 (0.59)1 = 4(0.41)3 (0.59)1 ≈ 0.163 P(x = 4) = 4 C4 (0.41)4 (0.59)0 = 1(0.41)4 (0.59)0 ≈ 0.028 Example Notes A survey indicates that 21% of men in the United States consider fishing their favorite leisure-time activity. You randomly select five U.S. women and ask them if fishing is their favorite leisure-time activity. Build the probability distribution. Although the formulas for mean, variance, and standard devaition can be used for binomial distributions, knowing the parameters n, p, q make the formulas much simpler. Population parameters of a binomial distribution Mean: µ = np Variance: σ 2 = npq √ Standard deviation: σ = npq Ex: A surgical procedure has an 85% chance of success. A doctor performs the procdure on eight patients. On average, there are µ = 6.8 successful surgeries performed. The standard deviation is σ ≈ 1.01. It would be unusual if values are more than two standard deviations away. That means fewer than 6.8 − 2(1.01) = 4.78 successes is unusual. Notes Assignment I Homework §4.2: 1, 2, 18, 20, 26, 31, 33 I Study Guide: Chapter Quiz 4: 1, 2, 3 I Extra review: Page 229: 19, 23, 25, 27 Notes Notes Notes


