STATISTICS 402B
advertisement
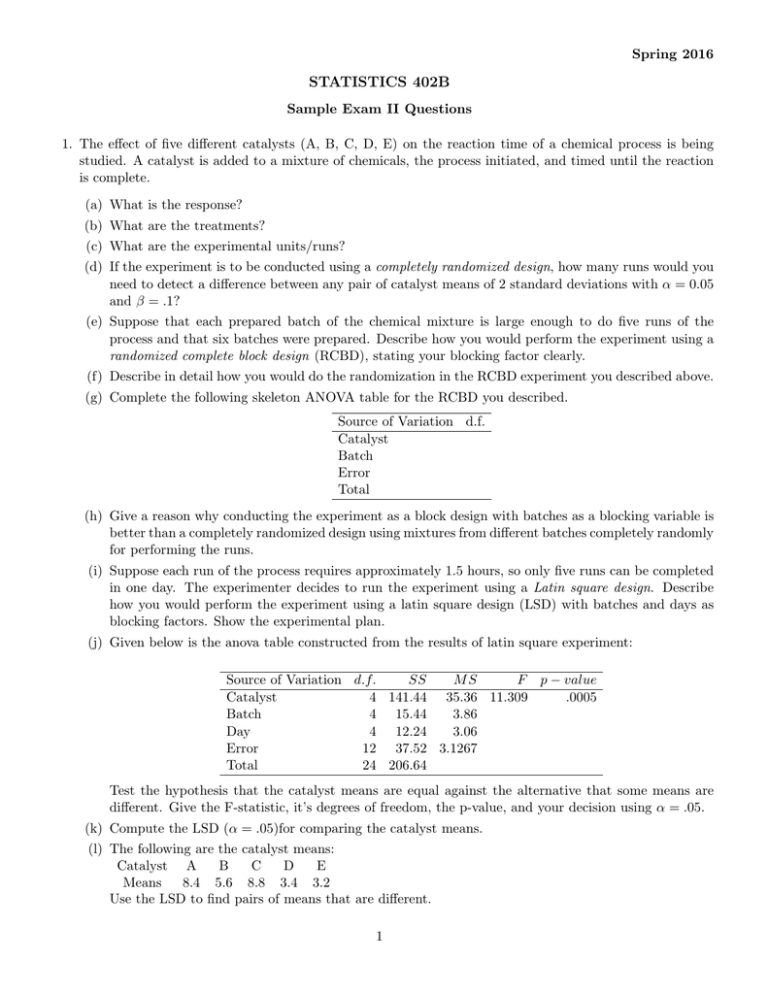
Spring 2016 STATISTICS 402B Sample Exam II Questions 1. The effect of five different catalysts (A, B, C, D, E) on the reaction time of a chemical process is being studied. A catalyst is added to a mixture of chemicals, the process initiated, and timed until the reaction is complete. (a) What is the response? (b) What are the treatments? (c) What are the experimental units/runs? (d) If the experiment is to be conducted using a completely randomized design, how many runs would you need to detect a difference between any pair of catalyst means of 2 standard deviations with α = 0.05 and β = .1? (e) Suppose that each prepared batch of the chemical mixture is large enough to do five runs of the process and that six batches were prepared. Describe how you would perform the experiment using a randomized complete block design (RCBD), stating your blocking factor clearly. (f) Describe in detail how you would do the randomization in the RCBD experiment you described above. (g) Complete the following skeleton ANOVA table for the RCBD you described. Source of Variation d.f. Catalyst Batch Error Total (h) Give a reason why conducting the experiment as a block design with batches as a blocking variable is better than a completely randomized design using mixtures from different batches completely randomly for performing the runs. (i) Suppose each run of the process requires approximately 1.5 hours, so only five runs can be completed in one day. The experimenter decides to run the experiment using a Latin square design. Describe how you would perform the experiment using a latin square design (LSD) with batches and days as blocking factors. Show the experimental plan. (j) Given below is the anova table constructed from the results of latin square experiment: Source of Variation d.f. SS MS F p − value Catalyst 4 141.44 35.36 11.309 .0005 Batch 4 15.44 3.86 Day 4 12.24 3.06 Error 12 37.52 3.1267 Total 24 206.64 Test the hypothesis that the catalyst means are equal against the alternative that some means are different. Give the F-statistic, it’s degrees of freedom, the p-value, and your decision using α = .05. (k) Compute the LSD (α = .05)for comparing the catalyst means. (l) The following are the catalyst means: Catalyst A B C D E Means 8.4 5.6 8.8 3.4 3.2 Use the LSD to find pairs of means that are different. 1 2. An experiment is conducted to explore the relationship between height of step (5.75 in or 11.5 in) and rate of stepping (14 steps/min, 21 steps/min or 28 steps/min) on the change of heart rate of college students. Six college students each are randomly allocated to each step height and stepping rate combination. There are 6 combinations of step height and stepping rate. Thus there were 36 students participating in the experiment. Each student experiences each combination. The order is randomized for each student and enough time separates the trials so that students heart rates return to a resting rate. The resting heart rate for each student is taken before each trial and the heart rate at the end of 3 minutes of the stepping combination is also measured. The change in heart rate is calculated by subtracting the resting heart rate from the heart rate after stepping. Refer to the JMP output for the Stepping Experiment. Note this output has been edited so that there are several blank spots. (a) What are the response, conditions of interest and experimental material? (b) What design was used to collect the data? Explain how you determined what design was used. (c) Write down the complete ANOVA table for this experiment. (d) Comment on the interaction plot. Describe what you see in the plot and what it indicates about the possible interaction between step height and stepping frequency. (e) Do the results from the ANOVA analysis confirm your above conclusion about interaction? Explain why? (f) Are there statistically significant differences among the sample means for the step heights? Report the appropriate F-statistic, P-value, decision, reason for the decision and conclusion. (g) Are there statistically significant differences among the sample means for the stepping frequencies? Report the appropriate F-statistic, P-value, decision, reason for the decision and conclusion. (h) For comparing treatment (combination of height and frequency) means the value of q is 3.08179. Compute the value of HSD. (i) What would your recommendation be if you wanted the largest average increase in heart rate? Support your answer statistically. 3. (a) Give two advantages of using a factorial experiment instead of single factor experiments to study effects of several factors. (b) Explain how to define the main effect A of a 22 factorial with factors A and B. Recall that the treatment means are identified using the notation (1), a, b, ab. (c) Explain how to define the interaction effect AB of a 22 factorial with factors A and B. Recall that the treatment means are identified using the notation (1), a, b, ab. (d) What is a 23 factorial experiment? How many runs does a 23 factorial with each treatment combination replicated twice have? (e) What are the numbers of degrees of freedom for Treatment and Error in the 23 factorial experiment in part (b)? (f) Give the defining contrast for any two-factor interaction in a 23 factorial experiment. (g) Suppose the 3-fi contrast and the Catalyst (1) a b ab Contrast + + Means 6.4 5.6 6.8 3.4 Calculate the 3-fi effect. treatment c ac + 3.2 7.2 totals for the experiment in part (d) are: bc abc + 4.5 5.0 2 JMP Analysis of Stepping Experiment Data Analysis of Variance Source DF Model Error C. Total Sum of Squares 6126.0000 3631.0000 9757.0000 35 Mean Square F Ratio 1225.20 121.03 10.1228 Prob > F <.0001* Effect Tests Source Nparm DF Frequency Height Frequency*Height Sum of Squares 3578.1667 2466.7778 81.0556 F Ratio Std Error Mean <.0001* <.0001* 0.7181 Effect Details Frequency Least Squares Means Table Level 14 21 28 Least Sq Mean 16.416667 28.250000 40.833333 16.4167 28.2500 40.8333 Height Least Squares Means Table Level 05.75 11.5 Least Sq Mean 20.222222 36.777778 Std Error Level 14,05.75 14,11.5 21,05.75 21,11.5 28,05.75 28,11.5 Least Sq Mean 10.166667 22.666667 19.500000 37.000000 31.000000 50.666667 Interaction Plot Mean 20.2222 36.7778 Frequency*Height Least Squares Means Table Std Error 4.4913497 4.4913497 4.4913497 4.4913497 4.4913497 4.4913497 Prob > F
