ARPES of Single Crystal Uranium (001)
advertisement
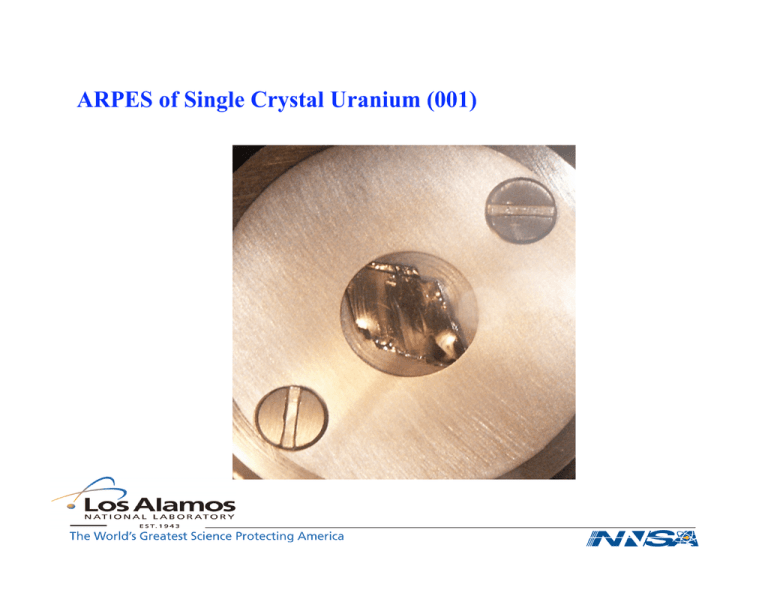
ARPES of Single Crystal Uranium (001) Angle Resolved Photoemission Spectroscopy (ARPES) of Single Crystal Uranium (001) Presented by: Cyril P. Opeil, S.J. In collaboration with: R. K. Schulze, R. C. Albers, B. Mihaila, K. B. Blagoev, M. E. Manley, J. C. Lashley, J. L. Smith of the Los Alamos National Laboratory and P. B. Littlewood of the Cavendish Laboratory, University of Cambridge Funding provided by the: Department of Energy LA-UR-06-0989 Why Study Uranium? Actinides possess itinerant to localized “f” electron behavior U(001) sample quality not previously available First comprehensive band map of an actinide now possible Actinide band map calculation -- improved accuracy LEED pattern of U(001) at T = 273 K 1st order 75 eV Real Space a = 2.854 Å b = 5.869 Å 2nd order c = 4.955 Å 150 eV Reciprocal space First U(001) LEED pattern, long range order bulk termination Calculation & Experiment < 2 % difference Structural reactivity studies: O2, D2, H2 I-V analysis underway ARPES - choose analyzer e- f Ekinetic = h" # e$ # Ebinding ! k II = 2meEkin etic 2 h surface normal azimuthal q to specify kvector to probe, and then vary polar f to collect DOS at various kII and observe dispersion of bands along k-vector hn q " sin # a-U(001) surface ! kZ Brillouin zone orientation Z [001] T G [100] Σ kX S (100) plane Y kY [010] a - Uranium Brillouin Zone Orthorhombic Space Group (b > a) Cmcm unit cell T. Hahn, International Tables for Crystallography, Dordrecht: The Netherlands, Kluwer Academic, 1992. ARPES Raw Data Stack Plot, along G to S φ = 60 degrees f = 0 degrees, ⊥ to U(001) surface Fermi Edge Uranium Band Map Sigma to Gamma, Gamma to Y, T = 173 K Intensity (arb. units) S G Y Binding Energy (eV) -2 -3 -4 -5 -6 Binding Energy (eV) -1 0 +1 ARPES: Σ - Γ - Y, Γ - S α -Uranium (001), T = 173 K ARPES & WIEN2K α -Uranium (001), T = 173 K Data Maxima, DDOS WIEN2K Calculations Band Structure Band Structure, Low Intensity d-Band, Tamm surface states f-Band, f-like, Shockley surface states Plasmon ?? Flat band near FE due to disorder ? Conclusions: Single crystal U(001) samples yield expected experimental LEED pattern (< 2% difference). Showing long range bulk termination. ARPES data exhibit band dispersion at 173 K and correlates favorably with DDOS WIEN2K. Narrow f-band near Fermi edge. Presence of d and f surface states. Data-Theory mismatch possibly due to: DT, e- to e-, e- to phonon contributions. Next Steps: Colder Temperatures, Higher Resolution Fermi Surface Mapping, at ALS, Berkeley, CA Matrix Element Calculation, DMFT Calculation With special thanks to my advisors: Roland K. Schulze J. L. Smith Funded by: Department of Energy
