NAME: MATH 1180 Midterm III
advertisement
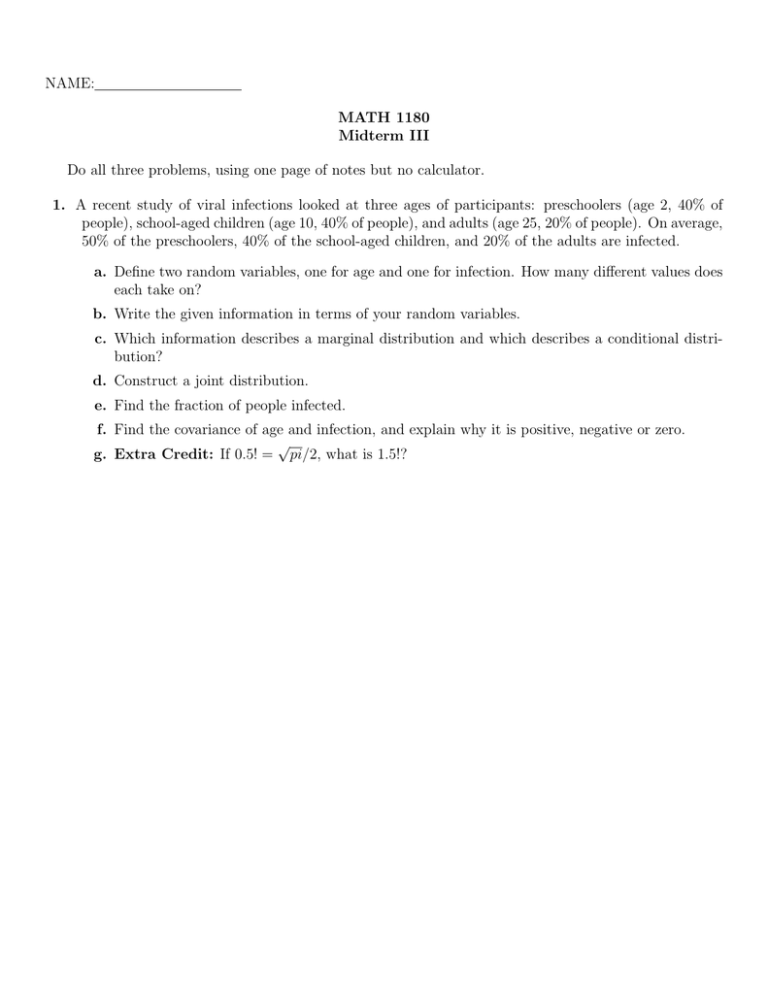
NAME: MATH 1180 Midterm III Do all three problems, using one page of notes but no calculator. 1. A recent study of viral infections looked at three ages of participants: preschoolers (age 2, 40% of people), school-aged children (age 10, 40% of people), and adults (age 25, 20% of people). On average, 50% of the preschoolers, 40% of the school-aged children, and 20% of the adults are infected. a. Define two random variables, one for age and one for infection. How many different values does each take on? b. Write the given information in terms of your random variables. c. Which information describes a marginal distribution and which describes a conditional distribution? d. Construct a joint distribution. e. Find the fraction of people infected. f. Find the covariance of age and infection, and explain why it is positive, negative or zero. √ g. Extra Credit: If 0.5! = pi/2, what is 1.5!? 2. The study sampled 100 adults, each of whom is infected independently with probability 0.1. a. What distribution will the number of infected adults follow? b. Find the expected number infected. c. Find the variance. d. Sketch a histogram of this distribution. e. Find the ratio of the probability that exactly 1 adult is infected to the probability that no adults are infected. f. Show (up to the point of computing the exact answer) how you would use the normal approximation to find the probability that exactly 10 adults are infected. g. Extra Credit: What special property does the normal distribution have that partially explains its appearance in the Central Limit Theorem? 3. Life is just a long series of viral infections. Preschoolers (ages 0-5) get them at a rate of 5.0/year. a. What distribution does the number of infections during the first year of life follow? What additional assumptions did you have to make? b. What is the covariance of the number of infections during the first 0.5 years and the number of infections during the second 0.5 years? Explain your answer. c. Find the expected number of infections and its variance during the first year of life. d. What is the probability of zero infections during the first year of life? What is the relationship of this value to the exponential distribution? e. If infections kept up at this rate, would you be surprised if a kid had 10 or fewer infections in 5 years? f. Extra Credit: If mathematicians formed a baseball team, what would they have as their mascot?
