In Situ Microstructure-Sensitive Investigation of Fracture by Coupling
advertisement
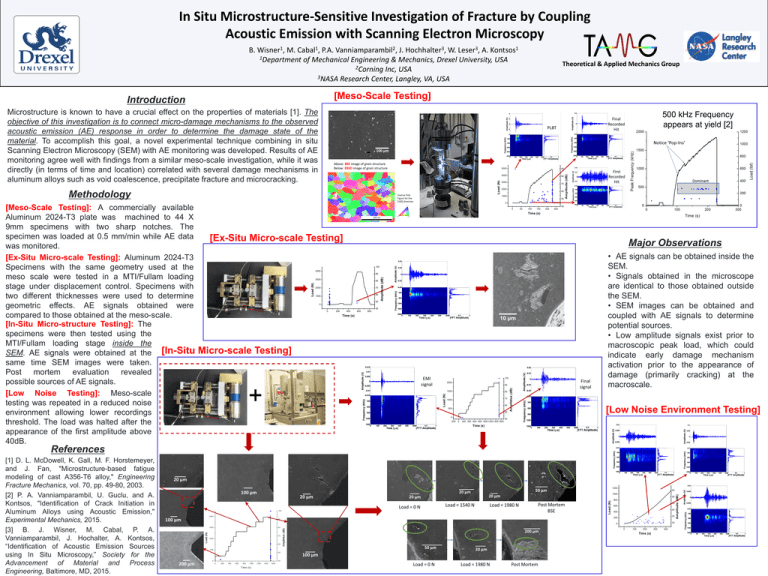
In Situ Microstructure-Sensitive Investigation of Fracture by Coupling Acoustic Emission with Scanning Electron Microscopy B. Wisner1, M. Cabal1, P.A. Vanniamparambil2, J. Hochhalter3, W. Leser3, A. Kontsos1 1Department of Mechanical Engineering & Mechanics, Drexel University, USA 2Corning Inc, USA 3NASA Research Center, Langley, VA, USA [Meso-Scale Testing] Introduction Microstructure is known to have a crucial effect on the properties of materials [1]. The objective of this investigation is to connect micro-damage mechanisms to the observed acoustic emission (AE) response in order to determine the damage state of the material. To accomplish this goal, a novel experimental technique combining in situ Scanning Electron Microscopy (SEM) with AE monitoring was developed. Results of AE monitoring agree well with findings from a similar meso-scale investigation, while it was directly (in terms of time and location) correlated with several damage mechanisms in aluminum alloys such as void coalescence, precipitate fracture and microcracking. 500 kHz Frequency appears at yield [2] Load (N) Above: BSE image of grain structure Below: EBSD image of grain structure Inverse Pole Figure for the [100] direction 5000 90 4000 80 3000 70 2000 60 1000 50 Amplitude (dB) 100 μm Methodology 0 40 0 50 100 150 200 250 Time (s) [Ex-Situ Micro-scale Testing] Major Observations 100 4000 3000 80 2000 70 60 1000 50 Amplitude (dB) 90 Load (N) 0 40 0 200 400 600 800 Time (s) Micro-scale Testing] EMI signal 100 2000 1500 80 70 1000 60 500 50 0 -200 Amplitdue (dB) 90 Load (N) [Meso-Scale Testing]: A commercially available Aluminum 2024-T3 plate was machined to 44 X 9mm specimens with two sharp notches. The specimen was loaded at 0.5 mm/min while AE data was monitored. [Ex-Situ Micro-scale Testing]: Aluminum 2024-T3 Specimens with the same geometry used at the meso scale were tested in a MTI/Fullam loading stage under displacement control. Specimens with two different thicknesses were used to determine geometric effects. AE signals obtained were compared to those obtained at the meso-scale. [In-Situ Micro-structure Testing]: The specimens were then tested using the MTI/Fullam loading stage inside the SEM. AE signals were obtained at the [In-Situ same time SEM images were taken. Post mortem evaluation revealed possible sources of AE signals. [Low Noise Testing]: Meso-scale testing was repeated in a reduced noise environment allowing lower recordings threshold. The load was halted after the appearance of the first amplitude above 40dB. Theoretical & Applied Mechanics Group Final signal • AE signals can be obtained inside the SEM. • Signals obtained in the microscope are identical to those obtained outside the SEM. • SEM images can be obtained and coupled with AE signals to determine potential sources. • Low amplitude signals exist prior to macroscopic peak load, which could indicate early damage mechanism activation prior to the appearance of damage (primarily cracking) at the macroscale. [Low Noise Environment Testing] 40 0 200 400 600 800 1000 1200 1400 1600 Time (s) References 1200 1000 50 800 45 600 40 400 35 200 30 0 0 100 200 Time (s) 300 400 Amplitude (dB) 55 Load (N) [1] D. L. McDowell, K. Gall, M. F. Horstemeyer, and J. Fan, "Microstructure-based fatigue modeling of cast A356-T6 alloy," Engineering Fracture Mechanics, vol. 70, pp. 49-80, 2003. [2] P. A. Vanniamparambil, U. Guclu, and A. Kontsos, "Identification of Crack Initiation in Aluminum Alloys using Acoustic Emission," Experimental Mechanics, 2015. [3] B. J. Wisner, M. Cabal, P. A. Vanniamparambil, J. Hochalter, A. Kontsos, “Identification of Acoustic Emission Sources using In Situ Microscopy,” Society for the Advancement of Material and Process Engineering, Baltimore, MD, 2015.
