Quantification of Radial Tie Fibers in the Knee Meniscus
advertisement
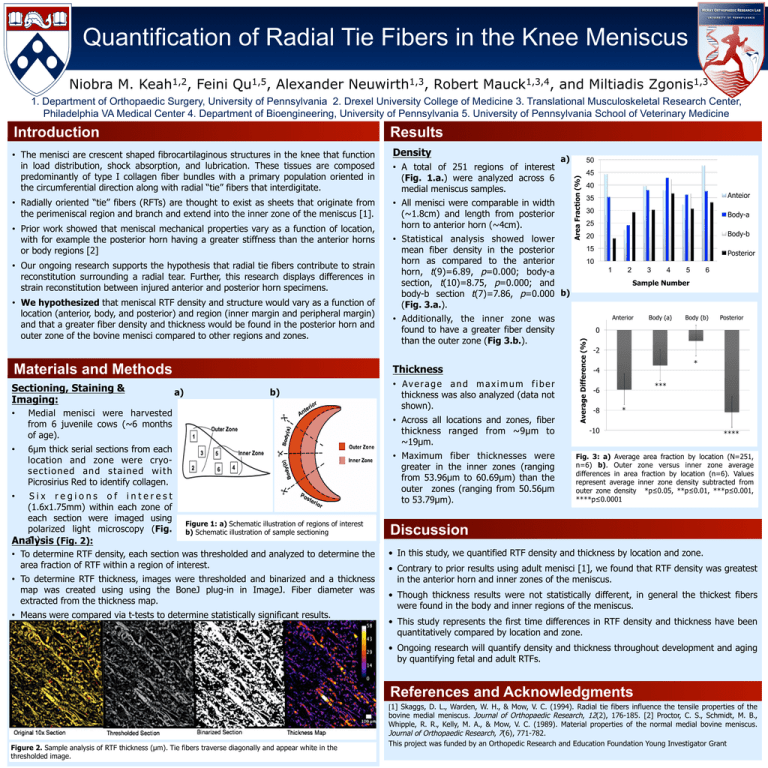
Quantification of Radial Tie Fibers in the Knee Meniscus Niobra M. 1,2 Keah , Feini 1,5 Qu , Alexander 1,3 Neuwirth , Robert 1,3,4 Mauck , and Miltiadis 1,3 Zgonis 1. Department of Orthopaedic Surgery, University of Pennsylvania 2. Drexel University College of Medicine 3. Translational Musculoskeletal Research Center, Philadelphia VA Medical Center 4. Department of Bioengineering, University of Pennsylvania 5. University of Pennsylvania School of Veterinary Medicine • The menisci are crescent shaped fibrocartilaginous structures in the knee that function in load distribution, shock absorption, and lubrication. These tissues are composed predominantly of type I collagen fiber bundles with a primary population oriented in the circumferential direction along with radial “tie” fibers that interdigitate. Density • Radially oriented “tie” fibers (RFTs) are thought to exist as sheets that originate from the perimeniscal region and branch and extend into the inner zone of the meniscus [1]. • Prior work showed that meniscal mechanical properties vary as a function of location, with for example the posterior horn having a greater stiffness than the anterior horns or body regions [2] • Our ongoing research supports the hypothesis that radial tie fibers contribute to strain reconstitution surrounding a radial tear. Further, this research displays differences in strain reconstitution between injured anterior and posterior horn specimens. • We hypothesized that meniscal RTF density and structure would vary as a function of location (anterior, body, and posterior) and region (inner margin and peripheral margin) and that a greater fiber density and thickness would be found in the posterior horn and outer zone of the bovine menisci compared to other regions and zones. • A total of 251 regions of interest (Fig. 1.a.) were analyzed across 6 medial meniscus samples. • All menisci were comparable in width (~1.8cm) and length from posterior horn to anterior horn (~4cm). • Statistical analysis showed lower mean fiber density in the posterior horn as compared to the anterior horn, t(9)=6.89, p=0.000; body-a section, t(10)=8.75, p=0.000; and body-b section t(7)=7.86, p=0.000 b) (Fig. 3.a.). • Additionally, the inner zone was found to have a greater fiber density than the outer zone (Fig 3.b.). Materials and Methods Thickness Sectioning, Staining & Imaging: • A v e r a g e a n d m a x i m u m f i b e r thickness was also analyzed (data not shown). • • a) b) Medial menisci were harvested from 6 juvenile cows (~6 months of age). 6µm thick serial sections from each location and zone were cryosectioned and stained with Picrosirius Red to identify collagen. Six regions of interest (1.6x1.75mm) within each zone of each section were imaged using Figure 1: a) Schematic illustration of regions of interest polarized light microscopy (Fig. b) Schematic illustration of sample sectioning 1.). (Fig. 2): Analysis • To determine RTF density, each section was thresholded and analyzed to determine the area fraction of RTF within a region of interest. • • To determine RTF thickness, images were thresholded and binarized and a thickness map was created using using the BoneJ plug-in in ImageJ. Fiber diameter was extracted from the thickness map. • Means were compared via t-tests to determine statistically significant results. a) • Across all locations and zones, fiber thickness ranged from ~9µm to ~19µm. • Maximum fiber thicknesses were greater in the inner zones (ranging from 53.96µm to 60.69µm) than the outer zones (ranging from 50.56µm to 53.79µm). 50 45 40 35 Anteior 30 Body-a 25 Body-b 20 15 Posterior 10 1 2 3 4 5 6 Sample Number Anterior Body (a) Body (b) Posterior 0 Average Difference (%) Results Area Fraction (%) Introduction -2 * -4 *** -6 -8 * -10 **** Fig. 3: a) Average area fraction by location (N=251, n=6) b). Outer zone versus inner zone average differences in area fraction by location (n=6). Values represent average inner zone density subtracted from outer zone density *p≤0.05, **p≤0.01, ***p≤0.001, ****p≤0.0001 Discussion • In this study, we quantified RTF density and thickness by location and zone. • Contrary to prior results using adult menisci [1], we found that RTF density was greatest in the anterior horn and inner zones of the meniscus. • Though thickness results were not statistically different, in general the thickest fibers were found in the body and inner regions of the meniscus. • This study represents the first time differences in RTF density and thickness have been quantitatively compared by location and zone. • Ongoing research will quantify density and thickness throughout development and aging by quantifying fetal and adult RTFs. References and Acknowledgments Figure 2. Sample analysis of RTF thickness (µm). Tie fibers traverse diagonally and appear white in the thresholded image. [1] Skaggs, D. L., Warden, W. H., & Mow, V. C. (1994). Radial tie fibers influence the tensile properties of the bovine medial meniscus. Journal of Orthopaedic Research, 12(2), 176-185. [2] Proctor, C. S., Schmidt, M. B., Whipple, R. R., Kelly, M. A., & Mow, V. C. (1989). Material properties of the normal medial bovine meniscus. Journal of Orthopaedic Research, 7(6), 771-782. This project was funded by an Orthopedic Research and Education Foundation Young Investigator Grant
