Eos More accurate measurements of total solar irradiance Tectonic plates relocked after 2005
advertisement

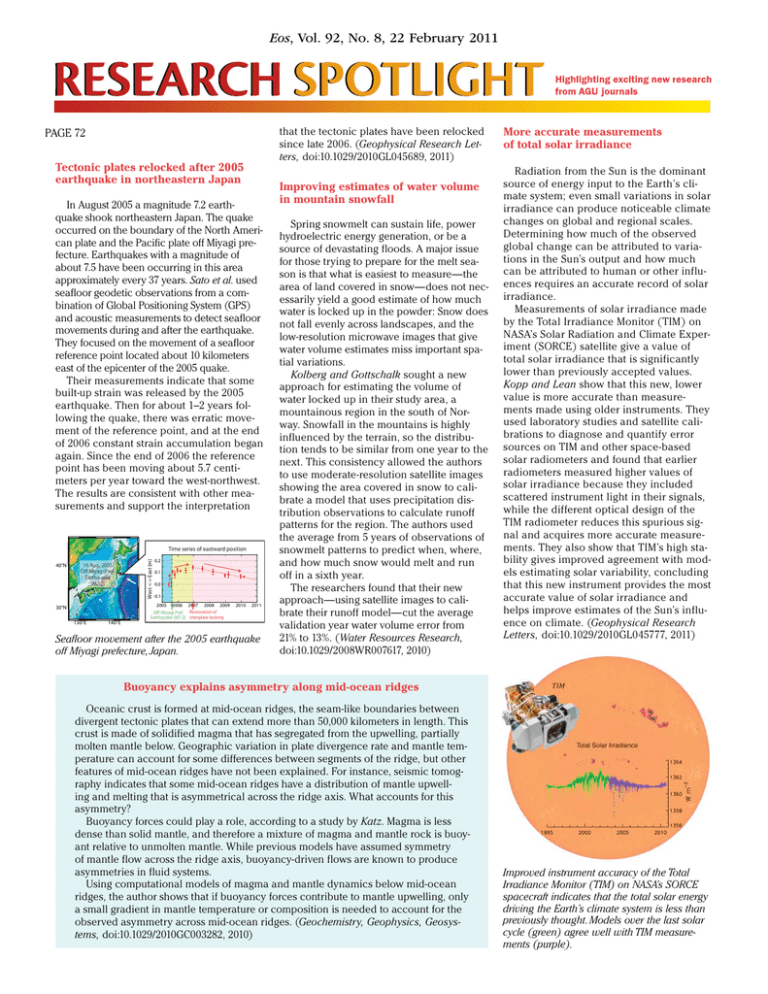
Eos, Vol. 92, No. 8, 22 February 2011 that the tectonic plates have been relocked since late 2006. (Geophysical Research Letters, doi:10.1029/2010GL045689, 2011) PAGE 72 Tectonic plates relocked after 2005 earthquake in northeastern Japan In August 2005 a magnitude 7.2 earthquake shook northeastern Japan. The quake occurred on the boundary of the North American plate and the Pacific plate off Miyagi prefecture. Earthquakes with a magnitude of about 7.5 have been occurring in this area approximately every 37 years. Sato et al. used seafloor geodetic observations from a combination of Global Positioning System (GPS) and acoustic measurements to detect seafloor movements during and after the earthquake. They focused on the movement of a seafloor reference point located about 10 kilometers east of the epicenter of the 2005 quake. Their measurements indicate that some built- up strain was released by the 2005 earthquake. Then for about 1–2 years following the quake, there was erratic movement of the reference point, and at the end of 2006 constant strain accumulation began again. Since the end of 2006 the reference point has been moving about 5.7 centimeters per year toward the west- northwest. The results are consistent with other measurements and support the interpretation 40°N West <-> East (m) Time series of eastward position 16 Aug, 2005 Off-Miyagi Pref. Earthquake (M7.2) 0.2 0.1 0.0 -0.1 2005 30°N 130°E 140°E 2006 2007 2008 2009 2010 2011 Off-Miyagi Pref. Restoration of Earthquake (M7.2) interplate locking Seafloor movement after the 2005 earthquake off Miyagi prefecture, Japan. Improving estimates of water volume in mountain snowfall Spring snowmelt can sustain life, power hydroelectric energy generation, or be a source of devastating floods. A major issue for those trying to prepare for the melt season is that what is easiest to measure— the area of land covered in snow— does not necessarily yield a good estimate of how much water is locked up in the powder: Snow does not fall evenly across landscapes, and the low-resolution microwave images that give water volume estimates miss important spatial variations. Kolberg and Gottschalk sought a new approach for estimating the volume of water locked up in their study area, a mountainous region in the south of Norway. Snowfall in the mountains is highly influenced by the terrain, so the distribution tends to be similar from one year to the next. This consistency allowed the authors to use moderate- resolution satellite images showing the area covered in snow to calibrate a model that uses precipitation distribution observations to calculate runoff patterns for the region. The authors used the average from 5 years of observations of snowmelt patterns to predict when, where, and how much snow would melt and run off in a sixth year. The researchers found that their new approach—using satellite images to calibrate their runoff model— cut the average validation year water volume error from 21% to 13%. (Water Resources Research, doi:10.1029/2008WR007617, 2010) More accurate measurements of total solar irradiance Radiation from the Sun is the dominant source of energy input to the Earth’s climate system; even small variations in solar irradiance can produce noticeable climate changes on global and regional scales. Determining how much of the observed global change can be attributed to variations in the Sun’s output and how much can be attributed to human or other influences requires an accurate record of solar irradiance. Measurements of solar irradiance made by the Total Irradiance Monitor (TIM) on NASA’s Solar Radiation and Climate Experiment (SORCE) satellite give a value of total solar irradiance that is significantly lower than previously accepted values. Kopp and Lean show that this new, lower value is more accurate than measurements made using older instruments. They used laboratory studies and satellite calibrations to diagnose and quantify error sources on TIM and other space- based solar radiometers and found that earlier radiometers measured higher values of solar irradiance because they included scattered instrument light in their signals, while the different optical design of the TIM radiometer reduces this spurious signal and acquires more accurate measurements. They also show that TIM’s high stability gives improved agreement with models estimating solar variability, concluding that this new instrument provides the most accurate value of solar irradiance and helps improve estimates of the Sun’s influence on climate. (Geophysical Research Letters, doi:10.1029/2010GL045777, 2011) Buoyancy explains asymmetry along mid- ocean ridges Oceanic crust is formed at mid- ocean ridges, the seam-like boundaries between divergent tectonic plates that can extend more than 50,000 kilometers in length. This crust is made of solidified magma that has segregated from the upwelling, partially molten mantle below. Geographic variation in plate divergence rate and mantle temperature can account for some differences between segments of the ridge, but other features of mid- ocean ridges have not been explained. For instance, seismic tomography indicates that some mid- ocean ridges have a distribution of mantle upwelling and melting that is asymmetrical across the ridge axis. What accounts for this asymmetry? Buoyancy forces could play a role, according to a study by Katz. Magma is less dense than solid mantle, and therefore a mixture of magma and mantle rock is buoyant relative to unmolten mantle. While previous models have assumed symmetry of mantle flow across the ridge axis, buoyancy- driven flows are known to produce asymmetries in fluid systems. Using computational models of magma and mantle dynamics below mid- ocean ridges, the author shows that if buoyancy forces contribute to mantle upwelling, only a small gradient in mantle temperature or composition is needed to account for the observed asymmetry across mid- ocean ridges. (Geochemistry, Geophysics, Geosystems, doi:10.1029/2010GC003282, 2010) Improved instrument accuracy of the Total Irradiance Monitor (TIM) on NASA’s SORCE spacecraft indicates that the total solar energy driving the Earth’s climate system is less than previously thought. Models over the last solar cycle (green) agree well with TIM measurements (purple). Eos, Vol. 92, No. 8, 22 February 2011 Climate commitment in an uncertain world River-­to-­lake connectivity and habitat diversity Lance Lesack The 45,000 lakes in the Mackenzie River delta, Canada, represent an especially diverse aquatic habitat compared to lakes in surrounding Arctic areas. River-­to-­lake connectivity River water renewal (colored river water over lake ice) seen in the Mackenzie River delta, Canada. Significant changes have taken place in the number and size of China’s lakes over the past several decades. To create a comprehensive picture of these changes over all of China, Ma et al. combined data from a wide variety of sources, including satellite imagery and maps. They compared data from the 1960s to the 1980s, before China’s rapid development and industrialization, with data from 2005 and 2006. The authors found that over that time period the total number of lakes with area greater than 1 square kilo­meter decreased from 2928 to 2693. The total surface area of Chinese lakes declined by 13% over that time period. In addition, 243 lakes vanished, mainly in the northern provinces and some southern provinces, while 60 new lakes appeared, mainly in the Tibetan Plateau region. Climate change and human activity can affect lakes. For instance, glacial melting on the Tibetan Plateau and neighboring areas may have led to the creation of new lakes and the expansion of existing lakes, while human development likely affected lakes in southern China. The results suggest that human activity could be the main influence on lakes in the south of China, while lakes in the north seem to have been affected primarily by climate change, though the authors note that more detailed regional studies are needed to confirm these preliminary, large-­scale observations. (Geophysical Research Letters, doi:10.1029/­2010GL045514, 2010) Jinglu Wu Even if humans immediately ceased emitting carbon dioxide (CO2) and other greenhouse gases, the planet would continue to warm, mainly due to thermal inertia of the world’s oceans. This “climate commitment” has been of interest recently for both science and policy because it provides a measure of the minimum climate change the planet will face given human activity that has already occurred. Several studies have looked at what would happen if human emission of CO2 were halted, but these studies have overlooked the role of aerosols and non-­CO2 greenhouse gases such as methane and nitrous oxide, which Armour and Roe include in a new study. If human emission stopped, atmospheric aerosols, which cool the planet by blocking light from the surface, would fall to preindustrial levels within weeks. However, non-­CO2 greenhouse gases would remain in the atmosphere for decades to centuries, and elevated levels of CO2 would persist for millennia. The authors found that the sudden loss of the cooling effect of aerosols would cause an abrupt warming of as much as 0.9°C above current temperatures in the decades following the cessation of emissions. This could be followed by slight cooling or by further increased warming. Because there are large uncertainties in current observations of aerosol radiative forcing, there are large uncertainties in climate commitment. The authors note that the Intergovernmental Panel on Climate Change’s climate models produce a narrower range of climate commitment than is allowed by constraints based on current observations. Although there is large uncertainty, the authors found that fundamental constraints provide lower and upper bounds on climate commitment. Given these bounds, if all human emission stopped immediately, Earth would still not return to preindustrial temperatures in the indefinite future, and we could already be committed to “dangerous” levels of warming. (Geophysical Research Letters, doi:10.1029/­2010GL045850, 2011) China’s lakes changed dramatically in recent decades China’s lakes have changed significantly in recent years, as evidenced by these images of the southwest portion of Aibi Lake in (left) August 2003 and (right) June 2010. could play a role in this diversity, as river water entering lakes replenishes nutrients and affects water transparency. Lesack and Marsh sought to better understand how river-­to-­lake connectivity affects biodiversity in the region. Using 40 years of data on water levels in the delta combined with a floodplain geometry model, they estimated the volumes of river water added to lake water during the annual flood peak for nine lakes at different elevations. The researchers also estimated the connection time between the lakes and the river by counting the number of days each year when the river water level exceeded the highest elevation along the channel connecting the lake and the river. In addition, they considered interannual variability of the river-­to-­lake connectivity for each of the nine lakes. The results showed a broad range of connectivities. Lakes with short and variable connection times had greater individuality, whereas lakes with longer and less varying connection times were more similar to one another. The researchers suggest that the wide variation in river-­to-­lake connectivity could be a key to the distinctive habitat and biodiversity in the delta.(Water Resources Research, doi:10.1029/­2010WR009607, 2010) Political bias in water quality monitoring When legislators put out a call for scientific information, they expect the response to be based on the most stringent data possible. But when the information comes from a large monitoring network—­like water quality measurements across Europe—­the results could be based on politics as much as on science. In the first study of its kind, Beck et al. used statistical methods to track the development of Europe’s water-­monitoring system from 1965 to 2004 in an attempt to tease out how the placement of monitoring stations might be influenced by economic and political pressures rather than by environmental needs. Some trends were expected: Monitoring increased with income, population density, and democracy and showed a general increase over time. Monitoring was also higher when a river crossed international boundaries than when it flowed through one nation alone. Another trend, however, ran against the researchers’ assumptions: Being a member of the European Union (EU) was related to lower monitoring densities. The authors suspected that countries that were not early members of the EU may have tried to curry favor with their neighbors by increasing their monitoring programs, while other governments felt no such pressure. The findings of political bias in the placement of water-­monitoring stations in the EU are especially important, because the EU has had a deliberate campaign to impose standards on monitoring. The authors assume that any biases seen for the EU will only be magnified for less regulated regions. (Water Resources Research, doi:10.1029/­2009WR009065, 2010) —Colin Schultz and Ernie Tretkoff, Staff Writers


