MONASH UNIVERSITY CARBON FOOTPRINT: 2005-2014
advertisement

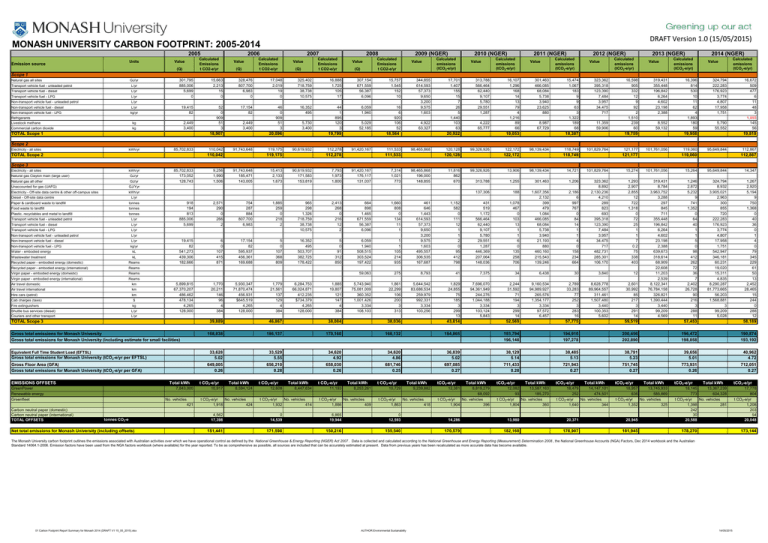
DRAFT Version 1.0 (15/05/2015) MONASH UNIVERSITY CARBON FOOTPRINT: 2005-2014 2005 Units Emission source 2006 Calculated Emissions t CO2-e/yr Value (Q) Value (Q) 2007 Calculated Emissions t CO2-e/yr Value (Q) 2008 Calculated Emissions t CO2-e/yr Value (Q) 2009 (NGER) Calculated Emissions t CO2-e/yr Value 2010 (NGER) Calculated emissions (tCO2-e/yr) Value 2011 (NGER) Calculated emissions (tCO2-e/yr) Value 2012 (NGER) Calculated emissions (tCO2-e/yr) Value 2013 (NGER) Calculated emissions (tCO2-e/yr) Value 2014 (NGER) Calculated emissions (tCO2-e/yr) Calculated emissions (tCO2-e/yr) Value Scope 1 Natural gas all sites GJ/yr Transport vehicle fuel - unleaded petrol L/yr Transport vehicle fuel - diesel L/yr Transport vehicle fuel - LPG L/yr Non-transport vehicle fuel - unleaded petrol L/yr Non-transport vehicle fuel - diesel L/yr Non-transport vehicle fuel - LPG kg/yr Refrigerants Livestock methane kg Commercial carbon dioxide kg 301,795 885,006 5,699 0 15,663 2,213 15 0 328,476 807,700 6,983 0 17,048 2,019 19 0 325,402 718,759 38,738 10,575 16,888 1,725 105 17 307,154 671,559 56,387 6,096 15,757 1,545 152 10 19,415 82 52 0 909 51 3 17,154 82 46 0 909 51 3 16,352 495 44 1 895 120 3 6,059 1,940 16 6 920 106 52 2,449 3,400 TOTAL Scope 1 2,449 3,400 18,907 5,730 3,400 20,096 5,029 52,185 19,799 344,855 614,593 57,373 9,650 3,200 9,575 1,603 4,922 63,327 18,564 17,701 1,407 155 15 7 26 5 1,440 103 63 313,788 566,464 62,440 9,107 5,780 29,551 1,287 4,222 65,777 20,922 16,107 1,296 168 14 13 79 4 1,216 89 66 301,463 466,085 68,084 5,738 3,940 23,625 880 8,987 67,729 19,053 15,474 1,067 183 9 9 63 3 1,322 189 68 323,362 395,318 123,390 7,484 3,957 34,475 717 11,359 59,906 18,387 16,598 905 332 12 9 92 2 1,510 239 60 319,431 355,448 196,842 6,264 4,602 23,198 2,388 8,552 59,132 19,759 16,396 814 530 10 11 62 4 1,893 180 59 324,794 222,283 176,923 3,774 4,807 17,958 1,751 5,790 55,552 19,958 16,672 509 477 6 11 48 3 1,893 145 56 19,818 Scope 2 Electricity - all sites kWh/yr 85,702,833 TOTAL Scope 2 110,042 91,743,648 110,042 119,175 90,619,932 119,175 112,278 91,420,167 112,278 111,533 98,465,868 111,533 120,128 99,326,926 120,128 122,172 98,139,434 122,172 118,749 101,829,764 118,749 121,177 101,761,056 121,177 119,060 95,649,844 119,060 112,867 112,867 Scope 3 Electricity - all sites kWh/yr Natural gas Clayton main (large user) GJ/yr Natural gas all other GJ/yr Unaccounted for gas (UAFG) GJ/Yyr Electricity - Off-site data centre & other off-campus sites kWh/yr Diesel - Off-site data centre 85,702,833 173,052 128,743 91,743,648 185,471 143,005 15,413 2,133 1,673 90,619,932 171,583 153,819 7,793 1,973 1,800 91,420,167 176,117 131,037 7,314 1,021 773 98,465,868 196,000 148,855 11,816 862 670 99,326,926 13,906 98,139,434 14,721 101,829,764 15,274 101,761,056 15,264 95,649,844 14,347 313,788 1,255 301,463 1,206 137,306 188 2,186 6 997 767 0 84 14 1 1 4 0 158 234 664 323,362 8,892 2,130,236 4,210 289 823 693 395,318 123,390 7,484 3,957 34,475 717 482,731 285,301 106,170 1,293 2,907 2,855 12 722 1,318 0 72 25 1 1 7 0.2 75 338 403 319,431 8,784 3,963,752 3,288 297 845 711 355,448 196,842 6,264 4,602 23,198 2,388 639,673 318,614 68,909 22,608 11,203 2,539 8,122,341 76,784,158 326,821 1,390,444 3,440 99,209 4,569 1,246 2,872 5,232 9 741 1,352 0 64 40 1 1 5 0 98 412 262 72 36 7 2,402 26,728 90 216 3 288 11 324,794 8,932 3,905,021 2,963 300 855 720 222,283 176,923 3,774 4,807 17,958 1,751 542,947 346,181 60,231 19,020 15,311 4,835 8,290,287 81,773,665 56,203 1,568,881 3 99,209 5,028 1,267 2,920 5,194 9 750 1,368 0 40 36 0 1 4 0 79 345 229 61 50 13 2,452 28,465 15 244 0 288 12 1 1 105 214 935 461 646 1,443 614,593 57,373 9,650 3,200 9,575 1,603 495,557 306,535 167,687 1,152 582 0 111 12 1 1 2 0 95 412 798 431 519 1,172 566,464 62,440 9,107 5,780 29,551 1,287 446,369 207,064 148,036 1,078 467 0 103 13 1 1 6 0 135 258 706 1,607,356 2,132 399 479 1,084 466,085 68,084 5,738 3,940 21,193 880 460,160 215,543 139,246 59,063 275 8,793 41 7,375 34 6,438 30 3,840 12 5,743,940 75,081,009 360,352 1,001,426 3,334 108,103 1,861 22,299 106 200 3 313 5,644,542 83,686,534 259,979 992,331 3,334 103,256 1,829 24,855 75 185 3 299 13 7,696,070 94,361,949 244,276 1,044,188 3,334 103,124 5,843 2,244 31,592 71 194 3 299 14 9,160,534 94,989,927 265,576 1,354,177 3,334 97,572 6,457 2,789 33,283 77 252 3 283 16 8,628,778 89,964,557 311,461 1,507,480 3,440 100,353 5,602 2,601 30,992 85 217 3 291 14 L/yr Paper & cardboard waste to landfill tonnes Food waste to landfill tonnes Plastic, recyclables and metal to landfill tonnes Transport vehicle fuel - unleaded petrol L/yr Transport vehicle fuel - diesel L/yr Transport vehicle fuel - LPG L/yr Non-transport vehicle fuel - unleaded petrol L/yr Non-transport vehicle fuel - diesel L/yr Non-transport vehicle fuel - LPG kg/yr Water - embodied energy kL Wastewater treatment kL Recycled paper - embodied energy (domestic) Reams Recycled paper - embodied energy (international) Reams Virgin paper - embodied energy (domestic) Reams Virgin paper - embodied energy (international) Reams Air travel domestic Air travel international km km Hire cars (petrol) km Cab charges (taxis) $ Fire extinguishers kg Shuttle bus services (diesel) Couriers and other transport L/yr L/yr 918 194 813 885,006 5,699 2,571 290 0 266 2 754 287 884 807,700 6,983 1,885 259 0 218 2 965 298 1,326 718,759 38,738 10,575 2,413 268 0 216 12 2 664 898 1,465 671,559 56,387 6,096 1,660 808 0 134 11 1 19,415 82 541,273 439,306 182,666 6 0 107 415 871 17,154 82 595,937 456,361 169,688 5 0 107 368 809 16,352 495 503,707 382,725 178,422 5 0 91 312 850 6,059 1,940 508,515 303,524 197,422 5,899,815 67,370,207 486,462 478,134 4,265 128,000 TOTAL Scope 3 Gross total emissions for Monash University Gross total emissions for Monash University (including estimate for small facilities) Equivalent Full Time Student Load (EFTSL) Gross total emissions for Monash University (tCO2-e/yr per EFTSL) Gross Floor Area (GFA) Gross total emissions for Monash University (tCO2-e/yr per GFA) EMISSIONS OFFSETS Total kWh GreenPower Renewable energy Greenfleet 7,843,000 No. vehicles 421 Carbon neutral paper (domestic) Carbon neutral paper (international) TOTAL OFFSETS 9,256 1,990 1,506 tonnes CO2-e Net total emissions for Monash University (including offsets) 1,770 20,211 146 96 4 384 5,930,347 71,870,474 456,931 $645,519 4,265 128,000 1,779 21,561 137 129 4 384 6,284,753 66,024,871 412,235 $734,379 4,265 128,000 1,885 19,807 121 147 4 384 39,889 46,867 38,084 38,036 43,814 52,569 57,775 59,519 57,453 58,189 168,838 186,137 170,160 168,132 184,865 193,794 196,148 194,910 197,278 200,456 202,890 196,472 198,858 190,874 193,192 33,628 5.02 33,529 5.55 34,620 4.92 34,620 4.86 36,839 5.02 38,129 5.14 38,485 5.13 38,791 5.23 39,656 5.01 40,962 4.72 649,005 0.26 656,210 0.28 658,030 0.26 681,746 0.25 697,085 0.27 711,433 0.28 721,943 0.27 751,745 0.27 773,931 0.26 712,051 0.27 t CO2-e/yr 10,917 Total kWh 8,594,124 t CO2-e/yr No. vehicles 1,918 424 t CO2-e/yr 12,608 Total kWh 8,447,634 t CO2-e/yr No. vehicles 1,932 414 t CO2-e/yr 11,193 Total kWh 8,253,261 t CO2-e/yr No. vehicles 1,886 409 t CO2-e/yr 10,729 Total kWh 9,239,882 t CO2-e/yr No. vehicles 1,863 418 tCO2-e/yr 12,381 Total kWh 8,819,279 68,092 t CO2-e/yr No. vehicles 1,904 396 tCO2-e/yr Total kWh 12,082 13,587,163 93 185,270 t CO2-e/yr No. vehicles 1,804 360 tCO2-e/yr Total kWh 18,479 14,147,101 252 474,501 t CO2-e/yr No. vehicles 1,640 344 tCO2-e/yr Total kWh 18,957 13,745,933 636 585,869 t CO2-e/yr No. vehicles 1,352 325 4,562 17,398 0 14,539 6,865 19,944 0 12,593 14,286 13,980 20,371 20,945 151,441 171,598 150,216 155,540 170,579 182,168 176,907 181,945 tCO2-e/yr Total kWh 18,145 13,367,239 773 604,328 t CO2-e/yr No. vehicles 1,398 281 242 30 20,588 178,270 AUTHOR:Environmental Sustainability 17,778 804 t CO2-e/yr 1,208 203 54 20,048 173,144 The Monash University carbon footprint outlines the emissions associated with Australian activities over which we have operational control as defined by the National Greenhouse & Energy Reporting (NGER) Act 2007 . Data is collected and calculated according to the National Greenhouse and Energy Reporting (Measurement) Determination 2008 , the National Greenhouse Accounts (NGA) Factors, Dec 2014 workbook and the Australian Standard 14064.1-2006. Emission factors have been used from the NGA factors workbook (where available) for the year reported. To be as comprehensive as possible, all sources are included that can be accurately estimated at present. Data from previous years has been recalculated as more accurate data has become available. 01 Carbon Footprint Report Summary for Monash 2014 (DRAFT V1 15_05_2015).xlsx tCO2-e/yr 14/05/2015


