Graduate Students M. F. Davis
advertisement
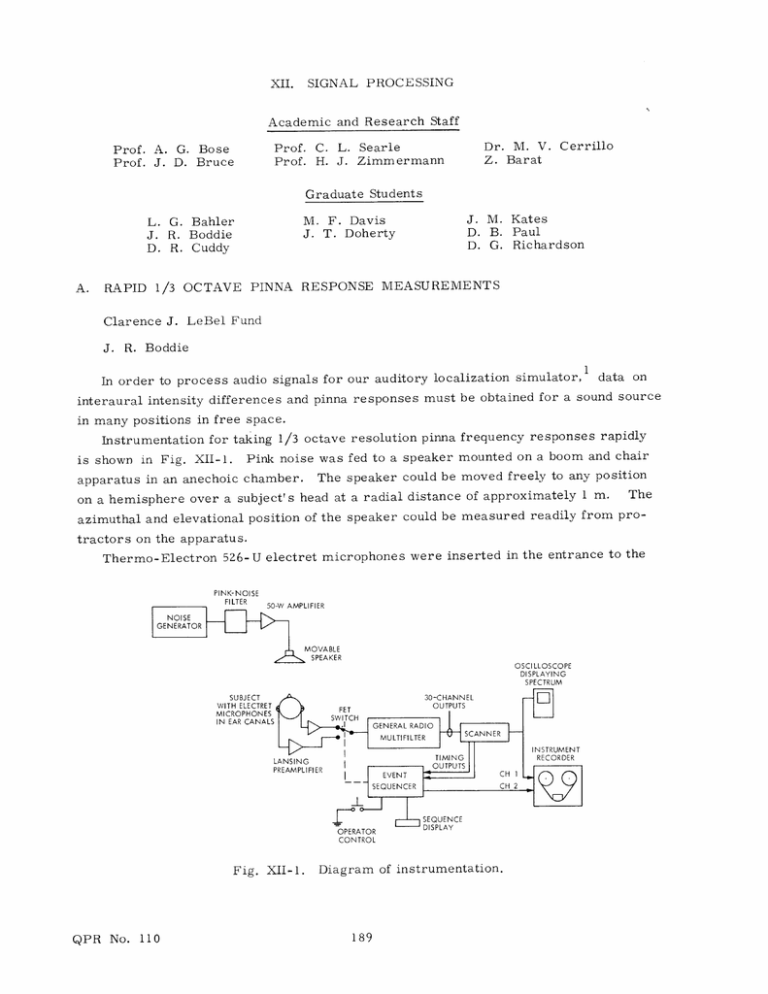
XII. SIGNAL PROCESSING Academic and Research Staff Prof. C. L. Searle Prof. H. J. Zimmermann Prof. A. G. Bose Prof. J. D. Bruce Dr. M. V. Z. Barat Cerrillo Graduate Students M. F. Davis J. T. Doherty L. G. Bahler J. R. Boddie D. R. Cuddy A. RAPID 1/3 OCTAVE PINNA RESPONSE Clarence J. J. J. M. Kates D. B. Paul D. G. Richardson MEASUREMENTS LeBel Fund R. Boddie data on In order to process audio signals for our auditory localization simulator, interaural intensity differences and pinna responses must be obtained for a sound source in many positions in free space. Instrumentation for taking 1/3 octave resolution pinna frequency responses rapidly Pink noise was fed to a speaker mounted on a boom and chair is shown in Fig. XII-1. apparatus in an anechoic chamber. The speaker could be moved freely to any position The on a hemisphere over a subject's head at a radial distance of approximately 1 m. azimuthal and elevational position of the speaker could be measured readily from protractors on the apparatus. Thermo-Electron 526-U electret microphones were inserted in the entrance to the PINK-NOISE FILTER 50-W AMPLIFIER NOISE GENERATOR MOVABLE SPEAKER OSCILLOSCOPE DISPLAYING SPECTRUM SUBJECT WITH ELECTRET MICROPHONES IN EAR CANALS OPERATOR CONTROL Fig. XII-1. QPR No. 110 Diagram of instrumentation. 189 (XII. SIGNAL PROCESSING) subject's ear canals. The microphone signals were amplified, and then commutated into the input of the 1/3 octave band multifilter by a switch controlled by the measurement event sequencer. The scanner detected the rms level on each filter channel, and fed a voltage proportional to the level in each channel serially to the instrument recorder. The spectrum could be viewed concurrently by connecting an oscilloscope to the scanner output (triggered on the timing pulses). The sequencer automatically controlled the events of the measurement first by switching the microphones, then gating timing pulses to the recorder, thereby indicating a valid measurement (after a suitable delay to allow the rms detectors to achieve steady state), and finally informing the operator to move the speaker to a new position. Data for 153 source positions representing a uniform density on the surface of the hemisphere were recorded in approximately one hour. References 1. J. R. Boddie, "Simulation of Auditory Signals for Localization," Quarterly Progress Report No. 108, Research Laboratory of Electronics, M.I.T., January 15, 1973, p. 352. 2. D. R. Cuddy, "Spectrum Scanner," Quarterly Progress Report No. 109, Research Laboratory of Electronics, M. I. T., April 15, 1973, p. 189. QPR No. 110 190


