Prof. L. D. Smullin
advertisement
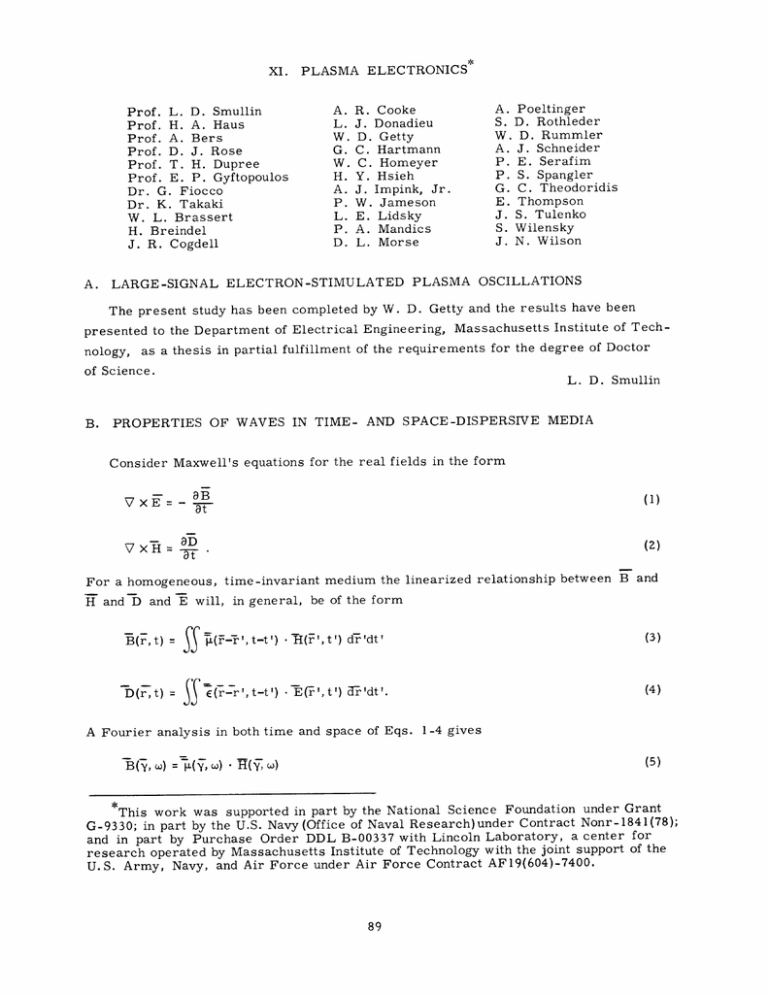
XI. Prof. L. D. Smullin Prof. H. A. Haus Prof. A. Bers Prof. D. J. Rose Prof. T. H. Dupree Prof. E. P. Gyftopoulos Dr. G. Fiocco Dr. K. Takaki W. L. Brassert H. Breindel J. R. Cogdell A. PLASMA ELECTRONICS* A. L. W. G. W. H. A. P. L. P. D. R. J. D. C. C. Y. J. W. E. A. L. Cooke Donadieu Getty Hartmann Homeyer Hsieh Impink, Jr. Jameson Lidsky Mandics Morse A. S. W. A. P. P. G. E. J. S. J. Poeltinger D. Rothleder D. Rummler J. Schneider E. Serafim S. Spangler C. Theodoridis Thompson S. Tulenko Wilensky N. Wilson LARGE-SIGNAL ELECTRON-STIMULATED PLASMA OSCILLATIONS The present study has been completed by W. D. Getty and the results have been presented to the Department of Electrical Engineering, Massachusetts Institute of Technology, as a thesis in partial fulfillment of the requirements for the degree of Doctor of Science. B. L. D. Smullin OF WAVES IN TIME- PROPERTIES AND SPACE-DISPERSIVE MEDIA Consider Maxwell's equations for the real fields in the form 8B at VxE=- V XH= (1) (2) at For a homogeneous, time-invariant medium the linearized relationship between B and H and D and E will, in general, be of the form B(r,t) = S (F- ', t-t ') (3) t(r ', t') dr 'dt' (4) E(r-r',t-t') -E(F',t') ct-'dt'. D(r,t) = A Fourier analysis in both time and space of Eqs. - (_ w) R 1-4 gives w) *This work was supported in part by the National Science Foundation under Grant G-9330; in part by the U.S. Navy (Office of Naval Research)under Contract Nonr-1841(78); and in part by Purchase Order DDL B-00337 with Lincoln Laboratory, a center for research operated by Massachusetts Institute of Technology with the joint support of the U.S. Army, Navy, and Air Force under Air Force Contract AF19(604)-7400. (XI. PLASMA ELECTRONICS) -(Y, W)= (Y, w) • -(y,w) y XE = j - F. and o. (7) -E E y xH = -j In Eqs. (6) (8) 7 and 8 we have not shown the explicit dependence of E, H, ., and E upon y In determining the properties of the waves it is convenient to restrict ourselves to a lossless medium. Thus S-= (9) E =E. (10) Here, the dagger denotes the complex conjugate transpose operation. Dot-multiplying Eq. 7 by H y.EXH y =jwH -E H . . -jwE and the complex conjugate of Eq. 8 by -E, we obtain H E (11) E. (12) Let y =a + j-A ~ 4 XR* 1 - 4 E 4 (13) =p H * + J =u E = u (14) m (15) e (16) We note that Eq. 14 is the complex Poynting vector, and Eqs. 15 and 16 are real but may be positive or negative. 11 and 12 then gives The sum and difference of Eqs. a • pe = 0 7-"4 e S- T Sqe From Eqs. (17) w(u -u e) (18) =W(u +ue ) (19) = 0. 17-20 we note that three kinds of waves are possible: P* 0), propagating waves (a= 0), and cutoff waves (P = 0). (20) complex waves (E In nondispersive media, um and u e are the energy densities, and the only waves that can exist are the propagating 0, PLASMA ELECTRONICS) (XI. waves (-= 0, uniform plane waves), and the complex waves (a # 0, p 0, nonuniform plane waves). Consider a variation of Eqs. 7 and 8: multiplied by (21) jw - 6E. (22) and adding to it the complex conjugate of Eq. 21 by H Eq. Dot-multiplying E - fH - j6(wE) 6y XH = -y x 61H H + j-" ) 6y XE = -y X 6E + j6(w 7 dot- 11, and dot-multiplying the complex conjugate of Eq. 22 and adding to it Eq. 8 dot-multiplied by -bE , we obtain *R EX 6y b(w) -jE b -- E XH H - y 6(ow) -• * -- H* -- H = jH - 6E XH E -* -- - "E Adding and subtracting Eqs. 23 and 24, xH - "6 and using Eqs. X 8H E - • E X 6H . (23) (24) 13 and 14, we establish the fol- lowing relationships: (25) 6(a. p ) = 0 4 e 4 6 .p e (26) . IRe (6E XH -EXH*) - ¥ H •6(wE)* • (w L)*H + (27) Im (6,XT---~X 6H) a-. (28) -. e ) = 0. 8 For propagating waves6- -e 1 -*H i and (wo) where (j-) 6(w) a( ) H + 1 E and Eq. 6(WE) are functions of w and 6 - = 0, y= j, - 8 + a (() ap 27 gives E, (-*2 (29) , so that (30) (XI. PLASMA ELECTRONICS) Substituting Eqs. 30 and 31 in Eq. 29, we obtain (14H -_ H) a( i* 1+ e a() * 4 - () 1 a(o) 1 H +-4E aw .- ) w (32) 4 We can now identify the time-average energy density w =- 4 H - a8 - H + -E 4 - E (33) and the time-average power density associated with the medium m 4 ap H- (34) aT Equation 34 provides a new way for identifying the linearized power density in a medium directly from the linearized tensor description of the medium. Equation 32 can now be written 6p' - (pe+pm)= w 6c. (35) At a fixed frequency we have 6 (36) ' Ce++Pm) = 0. Thus the total time-average power density vector, electromagnetic and medium, is perpendicular to the index surface (see Fig. XI-1). The group velocity vector also Pe + Pm INDEX SURFACE Fig. XI-1. Illustration showing the total time-average power density perpendicular to the index surface. (XI. follows from Eq. aw ap Pe PLASMA ELECTRONICS) 35: + Pm - m(37) and hence is also the energy velocity vector. = dispersive, p For anisotropic media that are only time- 0 and Eqs. 35-37 reduce to well-known relations. Work on the application of Eqs. 33-37 to electron-beam and warm plasma media will continue. A. Bers References 1. L. D. Landau and E. M. Lifshitz, Electrodynamics of Continuous Media (Pergamon Press, Oxford, N.Y., and Addison-Wesley Publishing Company, Inc., Reading, Mass., 1960); see Section 77. C. ELECTRON BEAM-PLASMA INTERACTION The studies of electron-stimulated plasma oscillations by Gettyl are being continued to investigate the possibility of ion heating by means of electron beam-plasma interactions. A pulser that is capable of delivering 10 kw peak power of pulse length that is variable from 1 to 100 jisec has been built by Peter Mandics of the Research Preliminary investigations in argon at pressures of 10Laboratory of Electronics. -3 to 10-3 mm Hg with magnetic field of 100 to 1000 gauss have shown these two general characteristics: (a) With long pulses the collector current increases to as much as twice the original beam current. (b) With low magnetic fields, the light intensity as observed by a 931A photomultiplier remains nearly constant throughout the length of the pulse after "beambreakup."2 Further investigations in hydrogen will include tracking of radiofrequency oscillations as a function of time, as well as detailed studies of light and current. H. Y. Hsieh References 1. W. D. Getty, Large-signal electron-stimulated plasma oscillations, Quarterly Progress Report No. 64, Research Laboratory of Electronics, M. I.T., January 15, 1962, pp. 113-117. 2. L. D. Smullin and W. D. Getty, Large-signal electron-stimulated plasma oscillations, Quarterly Progress Report No. 61, Research Laboratory of Electronics, M. I. T., April 15, 1961, pp. 33-36. (XI. D. PLASMA ELECTRONICS) ELECTRON BEAM-PLASMA INTERACTION EXPERIMENTS The apparatus described previously for the investigation of interactions between an electron beam and a plasma has been put into operation. The electron gun is driven by a 5- psec, 10,000-volt pulse at a repetition frequency of 250 cps. The beam passes down the axis of a "waveguide" constructed of copper screen, 6 inches long and 1. 5 inches in diameter, with a mesh size of approximately 0. 05 inch. The arc discharge is run outside this screen, and plasma diffuses through the "waveguide. " The system then approximates a plasma-filled waveguide for which the modes of propagation are well known. The diameter of the screen is small enough so that the fre- quencies of interest lie below the cutoff frequency of the empty waveguide, and hence the quasistatic analyses apply. The arrangement of the waveguide in the discharge chamber is shown in Fig. XI-2. RF COUPLING LOOP -- / "MAGNETIC SHIELD 6" COPPER SCREEN WAVEGUIDE BEAM COLLECTOR 1 1/2" DIA. ELECTRON GUN 'ARC CATHODE DC ARC DISCHARGE LONGITUDINAL MAGNETIC FIELD Fig. XI-2. Arrangement of components in discharge chamber. The spectrum of radiofrequency energy is observed by feeding a Panoramic Model RF 4a spectrum analyzer with the output from the coupling loop shown in Fig. XI-2 at the left end of the waveguide. The output of the analyzer, used as a receiver, is sampled at the time of the electron-beam pulse by a boxcar generator, and the output of this gen- erator is used to drive the y-axis of an x-y recorder. The x-axis of the recorder is driven at a constant velocity, and the spectrum analyzer tuning is changed at a constant rate. With this procedure, curves of rf power versus frequency in the range 350 mc10 kmc may be obtained. These curves have been plotted for various values of plasma density and magnetic Although no conclusive results have yet been obtained, there appear to field strength. be frequencies present which are nearly linearly related to the electron-cyclotron (XI. frequency. PLASMA ELECTRONICS) More experiments are planned to correlate the findings with the results predicted from the theory of plasma-filled waveguides containing electron beams. D. L. Morse References 1. D. L. Morse, Electron-beam plasma interaction experiments, Quarterly Progress Report No. 64, Research Laboratory of Electronics, M.I.T., January 15, 1962, pp. 93-94. E. ELECTRON-CYCLOTRON HEATING OF A PLASMA The experimental arrangement was described in Quarterly Progress Report No. 64 (pages 103-104). A preliminary series of tests with the high-power pulsed microwave source has been initiated. The diagram of the rf apparatus is shown in Fig. XI-3, and a section of the cavity is shown in Fig. XI-4. in the absence of plasma. The cavity has been designed to sustain the TE 0 11 mode The magnetic field produces a containment mirror configura- tion and also determines the conditions for cyclotron resonance. Fig. XI-3. Diagram of the microwave system. Experiments have been conducted in air at a pressure 5 X 10⁻⁴ mm Hg, for the following conditions of the rf source: incident peak power, ~ 0. 3 Mw; pulse length, 10 4sec; pulse repetition frequency, 100-500 cps; and frequency, 2780 kmc. Production of X-rays has been observed, with average levels of radiation equivalent to 1.5 roentgens/hour at Fig. XI-4. Cavity configuration with lines of constant magnetic field in the = 4. 3 amps. absence of plasma, for Imagne magnett 100 KEV TIME 0.5 MSEC Fig. XI-5. 0 X-ray production as indicated by scintillator output. PLASMA ELECTRONICS) (XI. 0. 25 meter from the cavity (brass walls, 4 mm thick), as measured with an ionization chamber. The bremsstrahlung radiation is also being studied with a scintillation spectrometer. Photons with energy up to 100 kev were obtained during the rf pulse, and an appreciable amount of radiation with energy extending to 30 kev was still detected 400 1sec after the application of the rf pulse. Figure XI-5 is a photograph of the scintillator output showing the decay of X-ray energy with time. exceeds 1017 electrons/m The electron density, during the pulse, 3 A B' TIME TIME I 0 Fig. XI-6. I 10 pSEC Streak photograph of initial transient of discharge (slit along AA'; exposure time, 10 [sec). I 0 Fig. XI-7. -I 10 pSEC Streak photograph of initial transient of discharge (slit along BB'; exposure time, 10 isec). Some streak photographs of the initial transient discharge have been obtained. The discharge is visible through a Plexiglas window covered by a copper screen. Figures XI-6 and XI-7 show the discharge during a 10-psec pulse; the orientations of the slit for the two pictures were parallel and perpendicular, respectively, to the axis of the magnetic field, as indicated by lines AA' and BB' in Fig. XI-4. G. Fiocco F. INVESTIGATION OF THE PENNING IONIZATION DISCHARGE The dependence of the voltage-current characteristics of a Penning discharge on magnetic field, gas pressure, and tube geometry is being studied. Probe measurements of the plasma column formed in the tube and measurements of cyclotron radiation generated by the discharge are being made. The discharge tube consists of a cylindrical anode and two discs at the ends of the cylinder for cathodes. A filament is mounted in the center of each disc to supply electrons to the discharge (Fig. XI-8). A positive voltage is applied to the anode, and an 1 Fig. XI-8. Penning discharge tube. B = 100 GAUSS B = 0 GAUSS '1 MA U -6 PRESSURE = 5 x 10 750 VOLTAGE Fig. XI-9. Tube characteristics. (XI. PLASMA ELECTRONICS) axial, dc magnetic field is applied. Current collected at the anode is plotted versus plate voltage on an x-y recorder. A variable leak allows adjustment of gas pressure from 3 X 10 - 6 mm Hg to 10 microns. Voltage in these experiments is varied from zero to 1500 volts, and magnetic field from zero to 600 gauss. The current collected is in the range zero to 5 ma. Tubes with two anode geometries have been tried. The anode of one tube consisted of a cylinder 3. 5 inches long and 2 inches in diameter, while the anode of another Top view o tube. (Pressure, 5 X 10⁻⁴ mm Hg; voltage, 650 volts; B field, 400 gauss; gas, argon.) Fig. XI-10. 2 I- Z z U 200 300 PLATE VOLTAGE Fig. XI-11. Current-voltage characteristic for magnetic field of 300 gauss and for argon at 4 X 10⁻⁴ mm Hg pressure. (XI. PLASMA ELECTRONICS) tube consisted of two loops of wire spaced 3. 5 inches apart and 2 inches in diameter. The current-voltage characteristics of the tubes were investigated in the pressure range 5 X 10⁻⁵ mm Hg to 10-3 mm Hg. At all pressures, a typical current-voltage curve with zero magnetic field is similar to a temperature-limited diode. However, with the mag- netic field at approximately 100 gauss, the I-V curve changes, as Fig. XI-9 shows. The same curve occurs regardless of whether voltage is increasing or decreasing. It was found that the current maxima (peaks) occurred at different voltages as the magnetic field was changed. The voltage at which the peaks occurred appeared to fol- low a relationship V/B = constant. tions or instabilities. The peaks appear to be associated with rf oscilla- In the regions between the peaks the plasma is usually visible as a reasonably well-defined column, as in Fig. XI-10. At the peaks the plasma appears to "blow out" and fill the entire tube. Figure XI-11 is an I-V curve for the cylindrical anode tube at a moderately high pressure. No evidence of the current peaks appears here. A. R. Cooke, G. C. 100 Hartmann
