An nne A Arunde el Co
advertisement
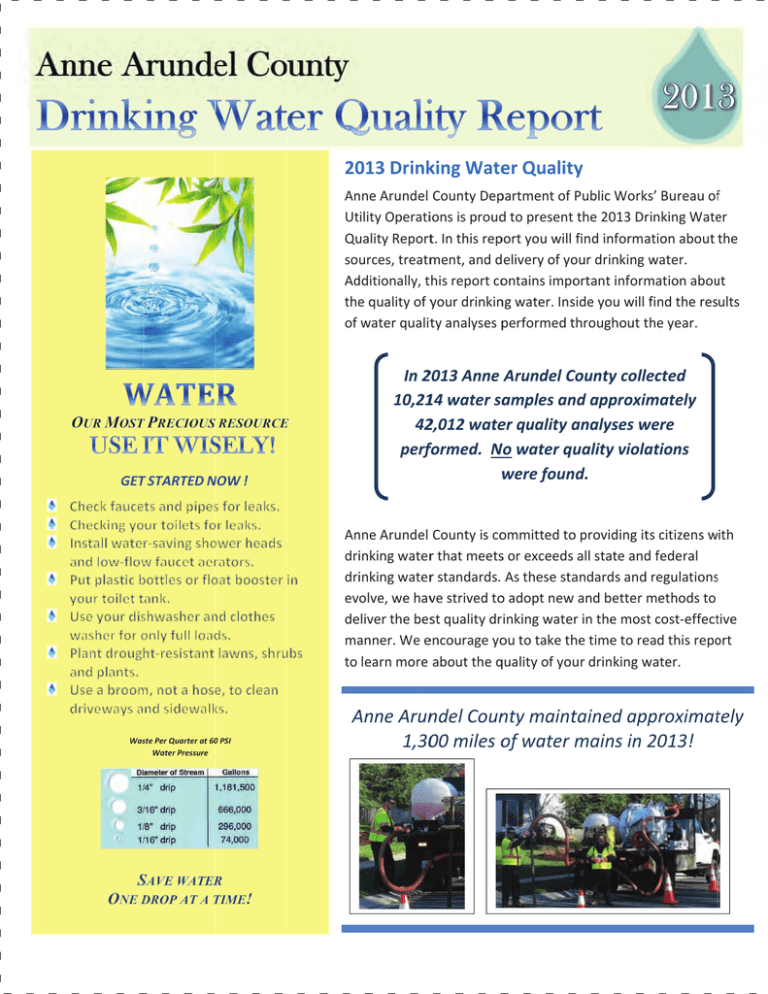
An nne Arunde A el County 20 013 DrinkkingWateerQualityy An nneArundelCountyDep partmentofPublicWorkks’Bureauoff UtilityOperatiionsisproud dtopresentthe2013DrrinkingWate er ualityReportt.Inthisrep portyouwillfindinformaationaboutthe Qu sources,treatm ment,anddeliveryofyo ourdrinkingwater. Ad dditionally,thisreportco ontainsimpo ortantinform mationabou ut the equalityofyyourdrinkin ngwater.Inssideyouwillfindtheresults ofwaterqualittyanalysesp performedtthroughoutttheyear. C Checkfauce etsandpipessforleaks. C Checkingyo ourtoiletsfo orleaks. IInstallwaterͲsavingsho owerheads aandlowͲflow wfaucetaerrators. P Putplasticb bottlesorflo oatboosterin yyourtoilettank. U Useyourdisshwasheran ndclothes w washerforo onlyfullload ds. P Plantdrough htͲresistantlawns,shru ubs aandplants. U Useabroom m,notahose e,toclean d drivewaysandsidewalkks. WasstePerQuarterat60 0PSI WaterPressure In22013 AnneArundelC Countycolllected 10,2114watersa amplesan ndapproxim imately 422,012wateerqualitya analysesw were perfformed.N Nowaterqu ualityviola ations w werefoun nd. An nneArundelCountyisco ommittedto oprovidingittscitizenswith driinkingwaterrthatmeetssorexceedsallstateand dfederal driinkingwaterrstandards. Asthesestaandardsand dregulationss evolve,wehavvestrivedto oadoptnewandbettermethodsto eliverthebesstqualitydrinkingwaterinthemostcostͲeffecttive de maanner.Weeencourageyo outotaketh hetimetoreeadthisrepo ort tolearnmore abouttheq qualityofyou urdrinkingw water. AnneArun A ndelCounntymainttainedap pproximattely 1,3000milesoofwatermainsin2013! TheWaterTreatmentProcess TheCounty’spublicwatersystemisdividedinto8waterserviceareas,asisillustratedinthemapinsideofthisreport.Allof theserviceareasreceivedrinkingwaterproducedatCountywatertreatmentfacilities.Twooftheserviceareasalsoreceive drinkingwaterthatispurchasedbytheCountyfromBaltimoreCity.TheCityfacilitiesusesurfacewaterfromreservoirsasa supply source. The County facilities only use ground water from wells as a supply source. Like the majority of the water utilitiesintheUnitedStates,AnneArundelCountyusesamultiͲsteptreatmentprocesstoensurethatthewaterdeliveredto ourcitizensisofthehighestquality.Belowisabriefdescriptionofthevariousstepsinthewatertreatmentprocess: WELLS AERATION CHEMICALADDITION Wateristakenfromunderground Onceremovedfromtheground, Chemicalssuchaschlorineand wells(150Ͳ1,550ftdeep)inthe wateristhenpassedthroughlarge limeareaddedtoadjustthepH Patapsco,Patuxent,andAquia aeratorstoaddoxygenandremove andtodisinfectthewater aquifers dissolvedgasses FILTRATION FLUORIDEADDITION COAGULATION,FLOCCULATION, SEDIMENTATION Filtrationfurtherremoves Fluorideisaddedtothewater Theseprocessesremovesolid suspendedmatterbypassing toaidinthepreventionof toothdecay particlessuchasiron thewaterthroughfiltermedia DISTRIBUTION Afterundergoingthetreatmentprocess,finishedwaterentersthedistributionsystem.Itisthendeliveredto118,951homesand businessesthroughoutAnneArundelCounty.Thewaterdistributionsystemiscomprisedofanetworkofover1,300milesofwater mains. In addition to water mains, the distribution system consists of fire hydrants, valves, elevated storage tanks, and various othercomponentsthatmakeitpossibleforthefinishedwatertobedeliveredtotheCounty’shomesandbusinesses. 2013SystemImprovements Eachyear,throughtheCapitalImprovementProgram,theCountymanages projectsdesignedtoimprovethedrinkingwatersystembyrespondingtoand anticipatingfuturegrowth,aswellaspreventingthedeteriorationoftheCounty’s existingsystem.Morethan80projectsatanestimatedcostof$172millionare onͲgoingatanytime. Oneoftheongoingprojectsin2013wasanupgradetothe26yearoldBroad CreekIIWaterTreatmentPlantinAnnapolis.The$26millionprojectinvolvedan upgradeofthecapacityfrom4to8MGDtomeettheneedsoftheBroadCreek ServiceAreathatissituatedinthecentralportionoftheCountysurroundingthe CityofAnnapolis,extendingfromtheSevernRivertoportionsoftheSouthRiver Colony. InadditiontotheBroadCreekIIWaterTreatmentPlantupgrade,otherprojects underwayin2013includedinstallationoftwonewElevatedStorageTanksat ElvatonandDisneyRoadaswellasrenovationtoseveralotherElevatedStorage TanksthroughoutAnneArundelCounty. DefinitionsofTermsUsedinthe WaterQualityDataTable ContactUs: Moreinformationaboutthe DepartmentofPublicWorks canbefoundbyvisitingonline: www.aacounty.org/dpw 410Ͳ222Ͳ8400 24HourEmergencyHotline (fromSouthCounty)410Ͳ451Ͳ4118 410Ͳ222Ͳ1144 BillingOffice DPWCustomerRelations 410Ͳ222Ͳ7582 DPWGeneralInformation410Ͳ222Ͳ7500 ImportantPhone#’s: EN ESPANOL: ESTE INFORME CONTIENE INFORMATION MUY IMPORTANTE. TRADUSCALO O HABLE CON UN AMIGOQUIENLOENTIENDABIEN. InformationaboutyourWaterSystem Inadditiontothisannualreport,informationabout your water system is provided in “Customer Updates” which are included in your utility bill, as well as comprehensive information on the Department of Public Works’ internet site at www.aacounty.org/dpw. Additional informational materialsmaybeobtainedfromthePublicWorks’ CustomerRelationsstaffbycalling410Ͳ222Ͳ7582. Most printed informational materials are also availableundertheCustomerRelationslinkonthe web site. In addition, all capital projects, which include improvements and/or additions to the water supply system, are included in the annual budget presented by the County Executive to the County Council each spring. Public hearings are held within the County and public comment is welcome. TheCountyalsomaintainsa“TenYearMasterPlan for Water Supply and Sewage Systems”. The CountyBudgetandMasterPlancanbereviewedat anybranchoftheCountylibrary.Forinformation on the Master Plan, contact the Long Range PlanningSection,OfficeofPlanningandZoning at410Ͳ222Ͳ7432 MaximumContaminantLevel(MCL):Highestlevel ofacontaminantallowedindrinkingwater.MCLs aresetasclosetoMCLG’sasfeasibleusingthebest availabletreatmenttechnology. MaximumContaminantLevelGoal(MCLG):Level ofcontaminantindrinkingwaterbelowwhich thereisnoknownorexpectedrisktohealth, MCLG’sallowforamarginofsafety. ActionLevel:Concentrationofacontaminant which,ifexceeded,triggersatreatmentorother requirementwhichawatersystemmustfollow. N/A:Notapplicable ND:Notdetectableattestinglimit NT:Nottested ppm:Partspermillionormilligramsperliter.One partpermillionistheequivalentof1centin $10,000oroneminuteintwoyears. ppb:Partsperbillionormicrogramsperliter.One partperbillionistheequivalentof1centin $10,000,000oroneminuteintwothousandyears. pCi/l:Partspertrillionorpicocuriesperliter(a measureofradiation) NTU:Nephelometricturbidityunits(ameasureof waterclarity) TT:Treatmenttechnique,arequiredprocess intendedtoreducethelevelofacontaminantin drinkingwater. ImportantInformationfromtheEPA Radiumisanaturallyoccurringsubstancewhich,ifexposed toacidicconditions(lowpH),canleachintogroundwater. TheEPAhassetmaximumcontaminantlevelsforradium thatarebasedonlifetimeexposure.TheCountyandState monitorthepublicwatersystem.Somepeople,whodrink watercontainingcombinedradiuminexcessoftheMCLover manyyears,mayhaveanincreasedriskofgettingcancer. However,theriskisverysmall. Radonisanaturallyoccurringradioactivegasthatmaycause cancer,andmaybefoundindrinkingwaterandindoorair. TheEPAadvisesthatsomepeoplewhoareexposedtoradon indrinkingwatermayhaveanincreasedriskofcancerover thecourseoftheirlifetime,especiallylungcancer.Radonin soilunderhomesisthebiggestsourceofradoninindoorair, andagreaterriskoflungcancerthanradonindrinking water.Formoreinformation,callEPA’sRadonHotline(800Ͳ SOSͲRADON)orvisitwww.epa.gov/radon.Testinghas indicatedthatradonisnotpresentthepublicwatersystem atconcentrationswhichwouldcauseanyhealthconcerns. Arsenicisanaturallyoccurringsubstance,which,if containedindrinkingwater,couldincreasetheriskof serioushealthconcernssuchascirculatoryproblems.The currentEPAlevelforthiscontaminantis0.01mg/l.Testing hasindicatedthatthereisnoarsenicinthepublicwater system. Lead,wheninelevatedlevels,cancauseserioushealth problems,especiallyforpregnantwomenandyoung children.Leadindrinkingwaterisprimarilyfrommaterials associatedwithservicelinesandhomeplumbing.The Countyisresponsibleforprovidinghighqualitydrinking water,butcannotcontrolthematerialsusedinplumbing components.Testingshowsthatleadisnotpresentinthe publicdrinkingwatersystematconcentrationsthatwould causehealthconcerns.Informationonleadindrinking water,testingmethods,andstepstominimizeexposureis availablefromtheEPASafeDrinkingWaterHotlineat1Ͳ800Ͳ 426Ͳ4791orathttp://epa.gov/safewater/lead. SourceWaterAssessmentisaprocessforevaluatingthe vulnerabilitytocontaminationofthesourceofapublic drinkingwatersupply.Theassessmentdoesnotaddressthe treatmentordistributionaspectsofthewatersystem,which arecoveredunderseparateprovisionsoftheSafeDrinking WaterAct.TheMarylandDepartmentoftheEnvironmentis theleadagencyindevelopingtheseAssessments,which havebeencompletedforalloftheCounty’swatersystems. Cryptosporidiumisamicroscopicparasitethatmaycause diarrhea,feverandgastroentericdisorders.Cryptosporidium maybefoundindrinkingwaterthatcomesfromsurface water,notfromundergroundaquifers.BaltimoreCityuses reservoirsandmonitorsitsrawwatersourcesfor cryptosporidium.Sampleswereanalyzedanddeterminedto befreeofviableorganisms.TheCityprotectsits’reservoirs topreventtheseorganismsfromenteringthewatersupply. Drinkingwater,includingbottledwater,mayreasonablybeexpectedtocontainsmallamountsofsomecontaminants. Thepresenceofcontaminantsdoesnotnecessarilyindicatethatwaterposesahealthrisk.Moreinformationabout contaminantsandpotentialhealtheffectscanbeobtainedbycallingtheEnvironmentalProtectionAgency’sSafeDrinking WaterHotlineat1Ͳ800Ͳ426Ͳ4791orbyvisitingwww.epa.gov/safewater. Somepeoplearemorevulnerabletocontaminantsindrinkingwaterthanthegeneralpopulation.ImmunoͲcompromised personssuchasthosewithcancer,undergoingchemotherapy,thosehavingundergoneorgantransplants,peoplewith HIV/AIDSorotherimmunesystemdisorders,someelderly,andinfantscanbeparticularlyatriskfrominfections.These peopleshouldseekadviceaboutdrinkingwaterfromtheirhealthcareproviders.EPA/CDCguidelinesonappropriate meanstolessentheriskofinfectionbyCryptosporidiumandothermicrobialcontaminantsareavailablefromtheSafe DrinkingWaterHotline. Thesourcesofdrinkingwater(bothtapandbottledwater)includerivers,lakes,streams,ponds,reservoirs,springsand wells.Aswatertravelsoverthesurfaceofthelandorthroughtheground,itdissolvesnaturallyoccurringmineralsand,in somecases,radioactivematerials,andcanpickupsubstancesresultingfromthepresenceofanimalsorfromhuman activity.Contaminantsthatmaybepresentinsourcewaterinclude: Microbialcontaminants,suchasvirusesandbacteria,whichmaycomefromwastetreatmentplants,septicsystems, agriculturallivestockoperations,andwildlife. Inorganiccontaminants,suchassaltsandmetals,whichcanbenaturallyoccurringorresultfromurbanstormrunoff, industrialordomesticdischarges,oilandgasproduction,miningorfarming. Pesticides&herbicides,comefromavarietyofsourcessuchasagriculture,stormwaterrunoffandresidentialuses. Organic chemical contaminants, including synthetic andvolatile organic chemicals,which are by products of industrial processesandpetroleumproduction,andcanalsocomefromgasstations,urbanstormwaterrunoff,andsepticsystems. Radioactivecontaminants,whichcanbenaturallyoccurringortheresultofoilandgasproductionandminingactivities. AnneArundelCountyWaterServiceAreas Pasadena/BaltimoreCity#1 GlenBurnie/BaltimoreCity#2 Broadneck Crofton/Odenton BroadCreek GibsonIsland HeraldHarbor RoseHaven 1 2 ACommitmenttoExcellence! DRINKING WATER QUALITY DATA --- 2013 PARAMETER MAXIMUM CONTAMINANT LEVELS UNITS MCL MCLG PASADENA / GLEN BURNIE / BALTIMORE CITY #2 BALTIMORE CITY BROADNECK ZONE #1 ZONE ZONE range of highest range of highest range of highest detection level detection level detection level CROFTON / ODENTON ZONE BROAD CREEK ZONE GIBSON ISLAND ZONE HERALD HARBOR ZONE ROSE HAVEN ZONE highest level range of detection highest level range of detection highest level range of detection highest level range of detection highest level range of detection NOTES TYPICAL SOURCES OF CONTAMINATION Microbiological Contaminants Total Coliforms Turbidity # N/A 0.27% N/A 0.27% N/A 0% N/A 0% N/A 0% N/A 0% N/A 0% N/A 0% 1 Naturally present in the environment. N/A 0.1 100% 0.2 100% NT N/A NT N/A NT N/A NT N/A NT N/A NT N/A 2 Soil run-off. < 5% positive 0% positive NTU TT Radioactive Contaminants Alpha Emitters pCi/l 15 0 3 1-3 3 ND - 3 1 1-1 NT N/A 1 1 -1 NT N/A 1 1-1 NT N/A 3, 6 Erosion and/or decay of natural deposits. Combined Radium pCi/l 5 0 3 1-3 3 ND - 3 1 1-1 NT N/A 1 1 -1 NT N/A 1 1-1 NT N/A 3, 6 Erosion and/or decay of natural deposits. Inorganic Contaminants Erosion and/or decay of natural deposits; discharge of drilling wastes; discharge from metal refineries. Erosion and/or decay of natural deposits; corrosion of household plumbing systems, discharge from metal refineries. Barium ppb 2000 2000 40 22 - 40 36 23 - 36 36 7 - 36 16 16 - 16 8 8-8 11 11 - 11 ND N/A 74 74 - 74 6 Cadmium ppb 5 5 ND N/A ND N/A ND N/A ND N/A ND N/A ND N/A ND N/A ND N/A 6 Fluoride ppm 4 4 1.4 ND - 1.4 1.7 ND - 1.7 1.5 ND - 1.5 1.0 0.1 - 1.0 1.1 ND - 1.1 1.7 ND - 1.7 1.5 0.4 - 1.5 1.4 ND - 1.4 Erosion and/or decay of natural deposits; water additive which promotes strong teeth; discharge from fertilizer and aluminum factories. Nitrate ppm 10 10 2.4 ND - 2.4 2.1 0.1 - 2.1 ND N/A ND N/A N/D N/A ND N/A ND N/A ND N/A Erosion and/or decay of natural deposits; leaching from septic tanks; sewage. Nickel ppb 100 N/A 6 6-6 18 11 - 18 ND N/A ND N/A ND N/A NT N/A ND N/A ND N/A 6 Erosion and/or decay of natural deposits; discharge of drilling wastes; discharge from metal refineries. Erosion and/or decay of natural deposits; corrosion of household plumbing systems. Erosion and/or decay of natural deposits; corrosion of household plumbing systems. Lead ppb AL = 15 0 3 0 5 0 8 0 4 0 9 0 4 0 5 0 8 0 5, 6 Copper ppb AL = 1300 1300 150 0 200 0 300 0 14 0 73 0 52 0 94 0 25 0 5, 6 4, 6 By-product of drinking water treatment processes. Disinfection By-Products Total Trihalomethanes ppb 80 N/A NT N/A NT N/A NT N/A ND N/A 2 ND _ 3.0 NT N/A NT N/A NT N/A Total Haloacetic Acids ppb 60 N/A NT N/A NT N/A NT N/A ND N/A ND N/A NT N/A NT N/A NT N/A Total Trihalomethanes ppb 80 N/A 24.3 ND - 77.0 1.8 ND - 7.5 1.0 ND - 4.1 1.0 ND - 2.8 3.1 2.5 - 3.7 2.0 1.3 - 3.3 1.4 ND - 3.0 18.8 12.1 - 25.7 4, 6 By-product of drinking water treatment processes. Total Haloacetic Acids ppb 60 N/A 13.5 ND - 41.9 0.1 ND - 2.3 ND N/A ND N/A ND N/A ND N/A ND N/A 11.2 6.0 - 15.9 4, 6 By-product of drinking water treatment processes. 2.4 0.3 - 2.4 NT N/A NT N/A NT N/A NT N/A NT N/A NT N/A 6 Volatile Organic Contaminants / Synthetic Organic Contaminants Tetrachloroethene ppb 5 0 NT N/A Leaching from pvc pipes; discharge from factories and dry cleaners. Unregulated Contaminants Methyl-tert-butyl-ether ppb N/A N/A ND N/A 0.7 ND - 0.7 NT N/A NT N/A NT N/A NT N/A NT N/A NT N/A Sodium ppm N/A N/A 4.4 4.4 - 4.4 12.3 5.5 - 12.3 3.8 2.3 - 3.8 4.4 4.4 - 4.4 4.4 4.4 - 4.4 4.5 4.5 - 4.5 3.2 3.2 - 3.2 9.0 8.0 - 9.0 6, 7 Chlorate ppb N/A N/A 180 64 - 180 210 210 - 210 210 150 - 210 590 190 - 590 580 570 - 580 NT N/A NT N/A NT N/A 6, 7 Chromium-6 ppb N/A N/A 0.04 0.04 - 0.04 ND N/A 0.04 0.03 - 0.04 0.04 .04 - .04 0.08 0.06 - 0.08 NT N/A NT N/A NT N/A 6, 7 Cobalt ppb N/A N/A 9.2 1.5 - 9.2 1.5 1.5 - 1.5 1.5 1.5 - 1.5 ND NA ND NA NT N/A NT N/A NT N/A 6, 7 Erosion and/or decay of natural deposits. 1,1-Dichlorethane ppb N/A N/A 0.03 0.03 - 0.03 ND N/A ND N/A ND NA ND NA NT N/A NT N/A NT N/A 6, 7 Discharge from factories. Strontium ppb N/A N/A 90 20 - 90 66 66 - 66 66 11 - 66 34 17 - 34 20 19 - 20 NT N/A NT N/A NT N/A 6, 7 Erosion and/or decay of natural deposits; discharge from metal refineries and fertilizers. Vanadium ppb N/A N/A 0.43 0.35 - 0.43 ND N/A 1.9 1.7 - 1.9 0.39 .21 - .39 ND NA NT N/A NT N/A NT N/A 6, 7 Erosion and/or decay of natural deposits; discharge from factories. Stage 1 Disinfection By Products Stage 2 Disinfection By Products Octane enhancer of fuel products. Naturally present in the environment; by-product of drinking water treatment processes. Naturally present in the environment; by-product of drinking water treatment processes. Erosion and/or decay of natural deposits; discharge of drilling wastes; discharge from metal refineries. On October 1, 2013, our system transitioned from the Stage 1 Disinfection Byproducts (DBP) Rule to the Stage 2 DBP Rule. The Stage 2 DBP Rule has different monitoring and reporting requirements than the Stage 1 DBP Rule. Stage 1 DBP data shown above (for Total Trihalomethanes (TTHM) and Haloacetic Acids (HAA5), reflect the system-wide averages of each contaminant group and the detected ranges for the system from the first three quarters of 2013. The Stage 2 DBP data shown above reflect the range of monitoring results from all Stage 2 TTHM and HAA5 monitoring locations from the fourth quarter of 2013. Subsequent consumer confidence reports will include only Stage 2 DBP Rule data. Notes for the Data Table: Note 1: The MCL and the MCLG for Total Coliforms is based on the percentage of positive coliform results in a given month. The MCL requires that less than or equal to 5% of the samples test positive. The percentage of positive sample results is shown in the range of detection column. Note 2: Turbidity standards are based on a treatment technique and are only applicable to systems using surface water as a source. The maximum Turbidity allowed in a given month is 1 NTU, and 95% of the results must be less than 0.3 NTU. This % is indicated in the range of detection column. Note 3: Compliance with the MCL for these contaminants is based on the average of four quarterly samples. Note 4: The range of detection numbers represents individual analysis results, not an average. There were no MCL violations at any facility. Note 5: Compliance with the MCL for Lead and Copper is based on the 90th percentile value of all analysis results. The number of sample results exceeding the MCL for these parameters is indicated in the range of detection column. Note 6: Testing for some parameters is not required on an annual basis. Some results reflect the most recent testing between 2011 and 2013. Note 7: Testing required by EPA to determine if an MCL/health standard should be set. General Note: The drinking water was analyzed for more than 120 other parameters. These contaminants do not appear in the data table because they were not detected. Presorted Standard US Postage PAID Permit No. 425 Southern, MD County Executive Laura Neuman AnneArundelCounty DepartmentofPublicWorks ChristopherPhipps,Director HeritageOfficeComplex 2662RivaRoad Annapolis,MD21401Ͳ7374 Contactus: Phone:410Ͳ222Ͳ7582 Fax:410Ͳ222Ͳ4374 EͲmail:pwcust00@aacounty.org Website:www.aacounty.org/dpw QualityReport 2013 D Drinking W Water Q AMessagefromtheCountyExecutive June2014 DearResidents, Iampleasedtoreportthatthedrinkingwaterproducedanddeliveredtoyourhomeiscleanand safeforconsumption.ProvidinghighqualitydrinkingwatertothecitizensofAnneArundel CountyisthenumberonegoaloftheprofessionalsintheBureauofUtilities. This 2013 Drinking Water Quality Report provides important information on the thousands of waterqualitytestsadministeredoverthepreviousyear.Asyouwillnote,thewaterweprovide fromaquifersdeepunderourCountyexceedsallFederalstandardsfordrinkingwaterqualityand safety. MycolleaguesattheDepartmentofPublicWorksandIarecommittedtocontinuingtoprovidehighqualitywater servicebymanagingandmaintainingourwaterinfrastructure.TheCountyhasalongͲstandingrecordofmeetingthese servicestandardsandwillcontinuetodoso. Sincerely, CountyExecutiveLauraNeuman Printed on recycled paper… Please recycle this report…


