V. GEOPHYSICS B. DeWolf Dr. J. F. Waymouth
advertisement

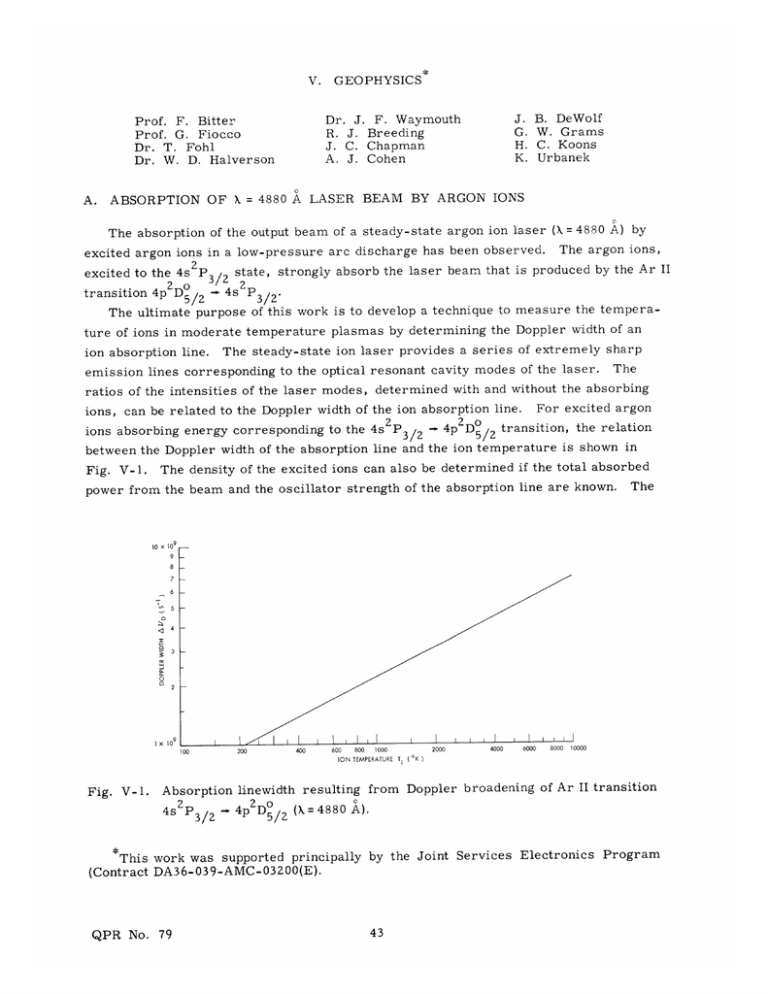
V. B. DeWolf W. Grams C. Koons Urbanek Dr. J. F. Waymouth R. J. Breeding J. C. Chapman A. J. Cohen Prof. F. Bitter Prof. G. Fiocco Dr. T. Fohl Dr. W. D. Halverson A. GEOPHYSICS ABSORPTION OF X = 4880 A LASER BEAM BY ARGON IONS The absorption of the output beam of a steady-state argon ion laser (X= 4880 A) by excited argon ions in a low-pressure arc discharge has been observed. The argon ions, excited to the 4s2 P 3/Z state, strongly absorb the laser beam that is produced by the Ar II transition 4p 2 D5/ o/25 3/2 3/ ' this work is to develop a technique to measure the temperaof The ultimate purpose ture of ions in moderate temperature plasmas by determining the Doppler width of an ion absorption line. The steady-state ion laser provides a series of extremely sharp emission lines corresponding to the optical resonant cavity modes of the laser. The ratios of the intensities of the laser modes, determined with and without the absorbing ions, can be related to the Doppler width of the ion absorption line. For excited argon transition, the relation 4p2 Do ions absorbing energy corresponding to the 4s2p 3 / 2 between the Doppler width of the absorption line and the ion temperature is shown in Fig. V-1. The density of the excited ions can also be determined if the total absorbed power from the beam and the oscillator strength of the absorption line are known. The 9 10 x 10 9 8 7 6 04 n3 9 Ix 10 100 Fig. V-l. 200 400 800 1000 600 ION TEMPERATURET. ( OK ) 2000 4000 6000 8000 10000 Absorption linewidth resulting from Doppler broadening of Ar II transition 4s 2 3/2 - 4p 2 D5/ 2 (X= 4880 A). This work was supported principally by the Joint Services Electronics Program (Contract DA36-039-AMC- 03200(E). QPR No. 79 (V. GEOPHYSICS) MONOCHROMETER 400cps CHOPPER ARGON ARC DISCHARGE ARGON ION LASER PHOTOMULTIPLIER ELECTROMETER UHF RADIO RECEIVER LOCK-IN AMPLIFIER 400 cps STRIP CHART RECORDER Fig. V-2. Experimental arrangement. = 0.11 torr DISCHARGE ARGON PRESSURE 0 E 0.04 0.03 - D z S0.4 0.02 - Z 0.2 0.01 o< 0 Fig. V-3. a-- 1 1 1 2 3 4 DISCHARGE CURRENT( amperes ) 5 Laser beam intensity transmitted through argon discharge and background radiation at X = 4880 A vs discharge current. oscillator strengths of important argon ion lines have been measured by Olsen. 1 For preliminary Fig. V-2 was set up. evaluation of this technique, the experimental arrangement of A steady-state argon ion laser (X= 4880 A) sends a beam through a second argon discharge in a capillary, 2-mm in diameter and 49 cm long. The beam is then sent into a Jarrell-Ash monochromator and the X = 4880 A component is detected by a photomultiplier. The transmitted laser beam intensity and the argon discharge background radiation at 4880 A, monitored directly at the photomultiplier output by a high-impedance electrometer, are shown in Fig. V-3 as a function of discharge current. The beam intensity decreases by 24 per cent as the absorbing discharge QPR No. 79 current is (V. GEOPHYSICS) increased from 0 to 5 amps. In order to have a preliminary idea of the absorption of the individual laser modes, the radiofrequency beats between the modes were detected by a UHF radio receiver. The signal-to-noise ratio of the receiver output is increased by chopping the transmitted laser beam at 400 sec -1 and amplifying the audio output with a Princeton Applied -1 Research lock-in amplifier tuned to 400 sec-. The laser modes are separated in frequency by approximately 150 Mc/sec. Preliminary measurements of the laser beat frequencies up to 1 Gc/sec have been made, but problems in obtaining reproducible data have been encountered because the laser output power had not been adequately stabilized. Modifications of the experimental arrangement are now under way which should correct this problem and extend the frequency spectrum. G. Fiocco, W. D. Halverson References 1. H. N. Olsen, J. B. OPTICAL DOPPLER RADAR I Quant. Spectroscopy and Rad. Transfer 3 59-76 (1963). Preliminary experiments to demonstrate the feasibility of developing an optical radar capable of measuring the velocity of moving reflectors are being carried out. MICHELSON INTERFEROMETER REFERENCE ARM DOPPLER WHEEL Fig. V-4. QPR No. 79 Detection system for an optical Doppler radar. Our aim (V. is GEOPHYSICS) to construct a pheric gases at device capable a distance, of measuring by the detection velocity distributions of the broadening and of atmos- shifting of a laser-emitted line. For this purpose, we have assembled in the laboratory the device illustrated in Fig. V-4. This is basically a Michelson interferometer in which the signal in one of the arms is reflected from a moving surface. a real target; The moving surface simulates the motion of in the present case it consists of a wheel, 180 teeth that can be rotated at various speeds. 25 cm in diameter, with The wheel is contained in an enclosure that can be evacuated in order to achieve high speeds. At present, however, rotates at 1800 rpm which results in a peripheral speed of 24 m/sec- the wheel Taking into . account the geometry of the encounter, the frequency shift is calculated to be approximately 45 Mc. The signal from the of the interferometer ysis is the fier carried out signal-to-noise is used in wheel is mixed with the signal from the and both are detected by a photomultiplier. with a radio ratio, receiver reference arm Frequency anal- with a bandwidth of 13 kc. To improve synchronous detection methods in which a lock-in ampli- conjunction with a beam chopper placed in the wheel arm have been employed. z 0 zm40 Fig. V-5. Figure the beat V-5 is signal at 50 FREQUENCY ( MEGACYCLES ) Power spectrum after detection. a reproduction 46. 6 Mc. The is caused by the fact that the moves faster on the inside signal, a number of the of the power line reflection edge has a conditions width occurs than on the necessary spectrum over outside for after detection of approximately the showing 1 Mc which surface of a tooth which edge. successful In obtaining this beat detection have been clarified. G. Fiocco, J. QPR No. 79 B. DeWolf (V. C. GEOPHYSICS) INVESTIGATION OF A REFLEX DISCHARGE Electron gyro frequency or cyclotron harmonic radiation has been observed from a hot-cathode reflex or Penning discharge. Probe measurements have been made and the No change in radiometer output 18 -3 maxima near the harmonics was observed for densities between 2 and 20 X 10 m density determined from the ion saturation currents. The discharge cavity was a water-cooled, stainless-steel cylinder, 19. 7 cm in diameter and 15. 2 cm high. 10. 2 cm apart. The anodes, also water-cooled, were hollow copper annuli, Spirals of 25-mil tungsten wire were used for cathodes (see Fig. V-6). These cathodes emitted tungsten copiously and soon developed hot spots that resulted in copious, but localized, emission of tungsten and electrons, and a bright pencil in the discharge. Magnetic fields of up to 0. 15 Wb/m within 3 cm of the axis of the cavity. 2 were used. The field was uniform 1 per cent The X-band radiometer had no filter before the mixer and so was sensitive to two 20 Mc/sec bands 120 Mc/sec apart. The IF ampli- fier detected output was fed through a P. A. R. lock-in amplifier to an X-Y recorder. A WINDOW ANODE TOT U.S RADIOMETER ETO Q PUMPS SPIRAL ANODE CATHODE SPIRAL WINDOW (b) (a) Fig. V-6. QPR No. 79 (a) Cavity seen from above. (b) Cavity seen from the North. TO RADIOMETER _ (V. h-L rC GEOPHYSICS) signal proportional to the current through the magnet coils was fed to the other axis of the recorder. Densities were calculated from the ion saturation current by using the small-sheath approximation. Sheath radii calculated from the V3/2 law were found to be between 1. 2 and 1. 4 times the probe radius which was 3 mil. The effect of the magnetic field on these results should be negligible because the probe radius was an order of magnitude smaller than the minimum ion gyro radius. The density could be changed by varying the neutral pressure in the cavity and/or the discharge current. Densities between 18 -3 2!and 20 X 10 m were obtained. The electron thermal energy was found to be approximately 3 ev. Figure V-7 shows some typical results for three different pressures. Peaks near the gyro-frequency harmonics were usually observed for harmonic numbers 3-10 and occasionally as high as 25. Within the accuracy of the system, the peaks were located right at the harmonics and no change with density could be found. Peaks not near the harmonics were also Fig. V-7. Radiometer output as a function of magnetic field; IDC = 0. 8 amp. The vertical present, but their occurrence and intensity were directly related to the prominence of the pencil in the plasma. scale is arbitrary, except that the lowest curve has been amplified by a factor of 100 with respect to the others, When the plasma was uniform these maxima were either greatly diminished or absent. The intensity of the peaks at the har- monics was also dependent on the strength of the pencil. In our future plans we envision improvement of the discharge by the use of other cathodes that will provide a uniform plasma. A filter and an IF amplifier with a nar- rower bandwidth will give narrower peaks and improved accuracy. QPR No. 79 Improvements in (V. GEOPHYSICS) probe design should extend the range and increase the accuracy of the density determinations. R. J. QPR No. 79 Breeding


