Students will learn about relationships between air pressure and weather... understandings about scientific inquiry, structure of the earth system, and... Activity 9
advertisement
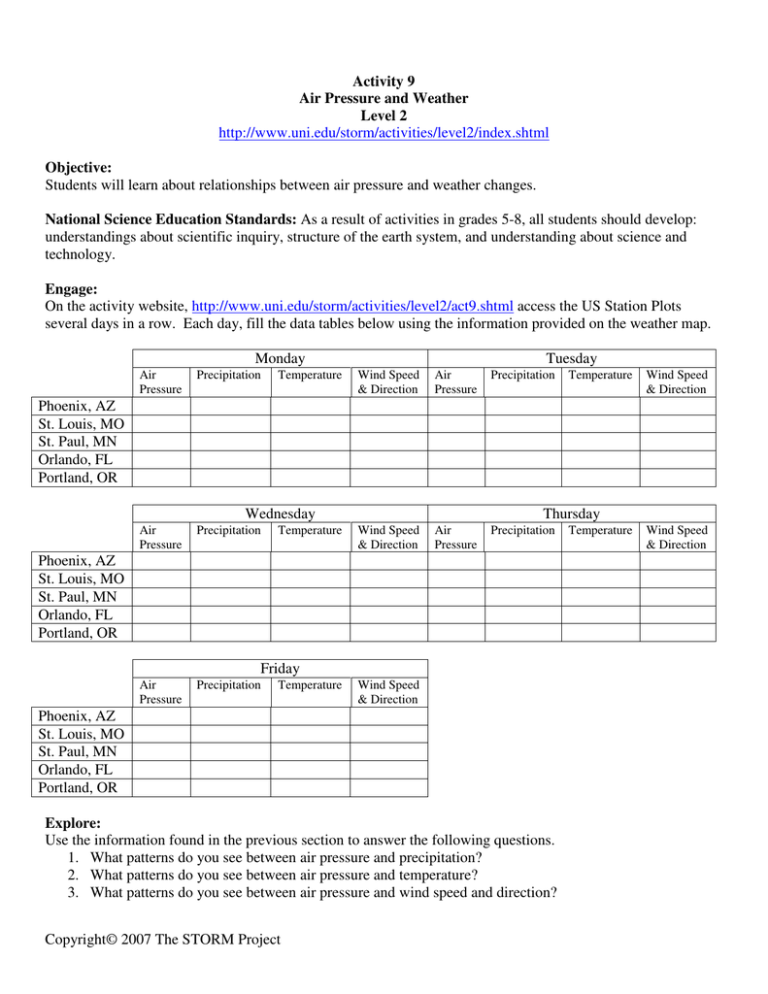
Activity 9 Air Pressure and Weather Level 2 http://www.uni.edu/storm/activities/level2/index.shtml Objective: Students will learn about relationships between air pressure and weather changes. National Science Education Standards: As a result of activities in grades 5-8, all students should develop: understandings about scientific inquiry, structure of the earth system, and understanding about science and technology. Engage: On the activity website, http://www.uni.edu/storm/activities/level2/act9.shtml access the US Station Plots several days in a row. Each day, fill the data tables below using the information provided on the weather map. Monday Air Pressure Precipitation Air Pressure Precipitation Air Pressure Precipitation Temperature Tuesday Wind Speed & Direction Air Pressure Precipitation Wind Speed & Direction Air Pressure Precipitation Temperature Wind Speed & Direction Phoenix, AZ St. Louis, MO St. Paul, MN Orlando, FL Portland, OR Wednesday Temperature Thursday Phoenix, AZ St. Louis, MO St. Paul, MN Orlando, FL Portland, OR Friday Temperature Wind Speed & Direction Phoenix, AZ St. Louis, MO St. Paul, MN Orlando, FL Portland, OR Explore: Use the information found in the previous section to answer the following questions. 1. What patterns do you see between air pressure and precipitation? 2. What patterns do you see between air pressure and temperature? 3. What patterns do you see between air pressure and wind speed and direction? Copyright© 2007 The STORM Project Temperature Wind Speed & Direction Explain: You may choose to discuss the following questions as a class (sharing background information) or have students work through them in partners/groups first. Make sure that students understand barometric pressure is another way of saying air pressure. 1. Over the five-day period, which city had the highest barometric pressure readings? Which day did this occur? Describe the general weather conditions for this city on that day. 2. Over the five-day period, which city had the lowest barometric pressure readings? Which day did this occur? Describe the general weather conditions for this city on that day. 3. Which city(ies) had little change in air pressure over the five-day period? Describe the general weather conditions for this/these city(ies). 4. What conclusion can you make about the connection between barometric pressure and general weather conditions? Extend: 1. From the activity website access the US Station Plots. Choose three different cities, not your city or the five cities from the Engage section. a. What is the barometric pressure reading for each city? b. Predict the general weather conditions for each city. 2. From the activity website access the Current Weather map. How does your prediction of the general weather conditions for each of your three cities compare with the actual weather? If they are not similar, explain what might have caused the differences. Evaluate: 1. Collect student sheets and monitor discussions. For Further Inquiry: How are changes in weather related to changes in pressure? From his vantage point in England in 1848, Rev. Dr. Brewer wrote in his A Guide to the Scientific Knowledge of Things Familiar the following about the relation of pressure to weather: The FALL of the barometer (decreasing pressure) • • • • • • In very hot weather, the fall of the barometer denotes thunder. Otherwise, the sudden falling of the barometer denotes high wind. In frosty weather, the fall of the barometer denotes thaw. If wet weather happens soon after the fall of the barometer, expect but little of it. In wet weather if the barometer falls expect much wet. In fair weather, if the barometer falls much and remains low, expect much wet in a few days, and probably wind. The barometer sinks lowest of all for wind and rain together; next to that wind, (except it be an east or north-east wind). Copyright© 2007 The STORM Project The RISE of the barometer (increasing pressure) • • • • • • In winter, the rise of the barometer presages frost. In frosty weather, the rise of the barometer presages snow. If fair weather happens soon after the rise of the barometer, expect but little of it. In wet weather, if the mercury rises high and remains so, expect continued fine weather in a day or two. In wet weather, if the mercury rises suddenly very high, fine weather will not last long. The barometer rises highest of all for north and east winds; for all other winds it sinks. The barometer UNSETTLED (unsteady pressure) • • • • If the motion of the mercury be unsettled, expect unsettled weather. If it stands at "MUCH RAIN" and rises to "CHANGEABLE" expect fair weather of short continuance. If it stands at "FAIR" and falls to "CHANGEABLE", expect foul weather. Its motion upwards, indicates the approach of fine weather; its motion downwards, indicates the approach of foul weather. These pressure observations hold true for many other locations as well but not all of them. Storms that occur in England, located near the end of the Gulf Stream, bring large pressure changes. In the United States, the largest pressure changes associated with storms will generally occur in Alaska and northern half of the continental U.S. In the tropics, except for tropical cyclones, there is very little day-to-day pressure change and none of the rules apply. Challenge your students to design an investigation to test these ideas, or any other question they might have about Air Pressure and Weather. Copyright© 2007 The STORM Project Activity 9 Air Pressure and Weather Student Sheets Engage: On the activity website, http://www.uni.edu/storm/activities/level2/act9.shtml access the US Station Plots several days in a row. Each day, fill the data tables below using the information provided on the weather map. Monday Air Pressure Precipitation Air Pressure Precipitation Air Pressure Precipitation Temperature Tuesday Wind Speed & Direction Air Pressure Precipitation Wind Speed & Direction Air Pressure Precipitation Temperature Wind Speed & Direction Phoenix, AZ St. Louis, MO St. Paul, MN Orlando, FL Portland, OR Wednesday Temperature Thursday Temperature Wind Speed & Direction Phoenix, AZ St. Louis, MO St. Paul, MN Orlando, FL Portland, OR Friday Temperature Wind Speed & Direction Phoenix, AZ St. Louis, MO St. Paul, MN Orlando, FL Portland, OR Explore: Use the information found in the previous section to answer the following questions. 1. What patterns do you see between air pressure and precipitation? ____________________________________________________________________________________ 2. What patterns do you see between air pressure and temperature? ____________________________________________________________________________________ 3. What patterns do you see between air pressure and wind speed and direction? ____________________________________________________________________________________ Copyright© 2007 The STORM Project Explain: You may choose to discuss the following questions as a class (sharing background information) or have students work through them in partners/groups first. Make sure that students understand barometric pressure is another way of saying air pressure. 1. Over the five-day period, which city had the highest barometric pressure readings? Which day did this occur? Describe the general weather conditions for this city on that day. ____________________________________________________________________________________ ____________________________________________________________________________________ ____________________________________________________________________________________ 2. Over the five-day period, which city had the lowest barometric pressure readings? Which day did this occur? Describe the general weather conditions for this city on that day. ____________________________________________________________________________________ ____________________________________________________________________________________ ____________________________________________________________________________________ 3. Which city(ies) had little change in air pressure over the five-day period? Describe the general weather conditions for this/these city(ies). ____________________________________________________________________________________ ____________________________________________________________________________________ ____________________________________________________________________________________ 4. What conclusion can you make about the connection between barometric pressure and general weather conditions? ____________________________________________________________________________________ ____________________________________________________________________________________ ____________________________________________________________________________________ Extend: 1. From the activity website access the US Station Plots. Choose three different cities, not your city or any of the five cities from the Explore section. c. What is the barometric pressure reading for each city? _________________________________________________________________________________ ___________________________________________________________________________ d. Predict the general weather conditions for each city. _________________________________________________________________________________ ___________________________________________________________________________ 2. From the activity website access the Current Weather map. How does your prediction of the general weather conditions for each of your three cities compare with the actual weather? If they are not similar, explain what might have caused the differences. __________________________________________________________________________________________ __________________________________________________________________________________________ __________________________________________________________________________________________ __________________________________________________________________________________________ Copyright© 2007 The STORM Project
