Regional Data File Activities 4 Unit Europe
advertisement
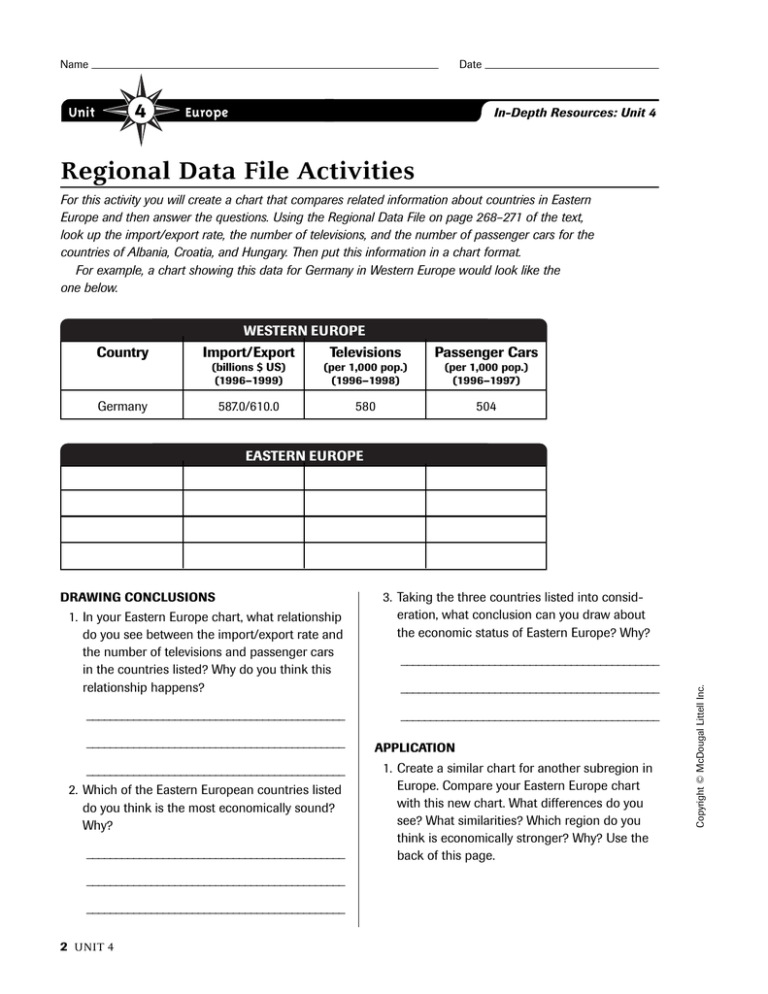
Name Date Unit 4 Europe In-Depth Resources: Unit 4 Regional Data File Activities For this activity you will create a chart that compares related information about countries in Eastern Europe and then answer the questions. Using the Regional Data File on page 268–271 of the text, look up the import/export rate, the number of televisions, and the number of passenger cars for the countries of Albania, Croatia, and Hungary. Then put this information in a chart format. For example, a chart showing this data for Germany in Western Europe would look like the one below. WESTERN EUROPE Country Import/Export Televisions Passenger Cars (billions $ US) (1996–1999) (per 1,000 pop.) (1996–1998) (per 1,000 pop.) (1996–1997) 587.0/610.0 580 504 Germany EASTERN EUROPE 1. In your Eastern Europe chart, what relationship do you see between the import/export rate and the number of televisions and passenger cars in the countries listed? Why do you think this relationship happens? ____________________________________________ ____________________________________________ ____________________________________________ 2. Which of the Eastern European countries listed do you think is the most economically sound? Why? ____________________________________________ ____________________________________________ ____________________________________________ 2 UNIT 4 3. Taking the three countries listed into consideration, what conclusion can you draw about the economic status of Eastern Europe? Why? ____________________________________________ ____________________________________________ ____________________________________________ APPLICATION 1. Create a similar chart for another subregion in Europe. Compare your Eastern Europe chart with this new chart. What differences do you see? What similarities? Which region do you think is economically stronger? Why? Use the back of this page. Copyright © McDougal Littell Inc. DRAWING CONCLUSIONS
