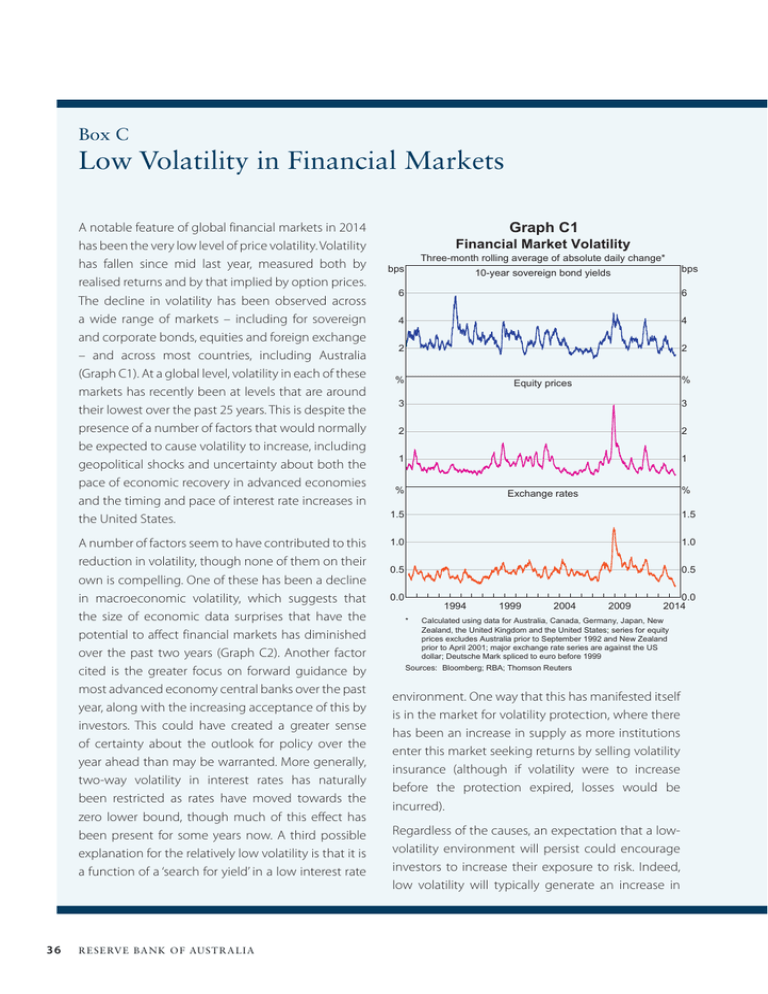
Low Volatility in Financial Markets Box C Graph C1
advertisement

Box C Low Volatility in Financial Markets A notable feature of global financial markets in 2014 has been the very low level of price volatility. Volatility has fallen since mid last year, measured both by realised returns and by that implied by option prices. The decline in volatility has been observed across a wide range of markets – including for sovereign and corporate bonds, equities and foreign exchange – and across most countries, including Australia (Graph C1). At a global level, volatility in each of these markets has recently been at levels that are around their lowest over the past 25 years. This is despite the presence of a number of factors that would normally be expected to cause volatility to increase, including geopolitical shocks and uncertainty about both the pace of economic recovery in advanced economies and the timing and pace of interest rate increases in the United States. A number of factors seem to have contributed to this reduction in volatility, though none of them on their own is compelling. One of these has been a decline in macroeconomic volatility, which suggests that the size of economic data surprises that have the potential to affect financial markets has diminished over the past two years (Graph C2). Another factor cited is the greater focus on forward guidance by most advanced economy central banks over the past year, along with the increasing acceptance of this by investors. This could have created a greater sense of certainty about the outlook for policy over the year ahead than may be warranted. More generally, two-way volatility in interest rates has naturally been restricted as rates have moved towards the zero lower bound, though much of this effect has been present for some years now. A third possible explanation for the relatively low volatility is that it is a function of a ‘search for yield’ in a low interest rate 36 R es erv e Ba nk of Aus t r a l i a Graph C1 Financial Market Volatility Three-month rolling average of absolute daily change* bps 10-year sovereign bond yields bps 6 6 4 4 2 2 % % Equity prices 3 3 2 2 1 1 % % Exchange rates 1.5 1.5 1.0 1.0 0.5 0.5 0.0 1994 * 1999 2004 2009 0.0 2014 Calculated using data for Australia, Canada, Germany, Japan, New Zealand, the United Kingdom and the United States; series for equity prices excludes Australia prior to September 1992 and New Zealand prior to April 2001; major exchange rate series are against the US dollar; Deutsche Mark spliced to euro before 1999 Sources: Bloomberg; RBA; Thomson Reuters environment. One way that this has manifested itself is in the market for volatility protection, where there has been an increase in supply as more institutions enter this market seeking returns by selling volatility insurance (although if volatility were to increase before the protection expired, losses would be incurred). Regardless of the causes, an expectation that a lowvolatility environment will persist could encourage investors to increase their exposure to risk. Indeed, low volatility will typically generate an increase in Graph C2 Indicators of Economic Volatility One-year rolling standard deviation of monthly change ’000s US non-farm payrolls Global industrial production* ppt 200 1.6 100 0.8 0 0.0 2014 1994 * 2004 1994 2004 Excludes China prior to February 1994, Indonesia and the Philippines prior to February 1993 and Chile prior to January 1991 Sources: CEIC Data; RBA; Thomson Reuters; United Nations risk-taking for investors that employ value-at-risk models. An important way in which this increase in risk-taking can occur is via greater leverage, since a persistent decline in volatility – all else equal – improves the risk-return trade-off associated with leveraged positions. This increase in leverage could occur either directly, via an increase in debt held against assets (such as margin loans to purchase equities), or indirectly, via an increase in investors’ exposure to more highly leveraged borrowers. Lower volatility can also encourage investors to increase their exposure to markets that historically have higher risk, such as ‘risk-sensitive’ currencies or higher-yielding securities. There is some evidence that leverage held against assets has risen and that investors are increasing their exposure to riskier assets, but the increase in leverage to date has not been particularly large. History suggests that the current low volatility environment will not persist indefinitely. When a shock eventually occurs that is sufficiently large to cause volatility to increase, investors that had responded to the earlier decline in volatility by increasing leverage or their exposure to riskier assets could face significant losses. The resulting unwinding of these positions in an environment where there are large numbers of investors seeking to exit the same positions increases the likelihood that some markets could become one-sided, thereby exacerbating the initial rise in volatility. R STATE ME N T O N MO N E TARY P O L ICY | au g u s t 2 0 1 4 37 38 R es erv e Ba nk of Aus t r a l i a


![[These nine clues] are noteworthy not so much because they foretell](http://s3.studylib.net/store/data/007474937_1-e53aa8c533cc905a5dc2eeb5aef2d7bb-300x300.png)


