Box A: Volatility in Global Financial Markets
advertisement

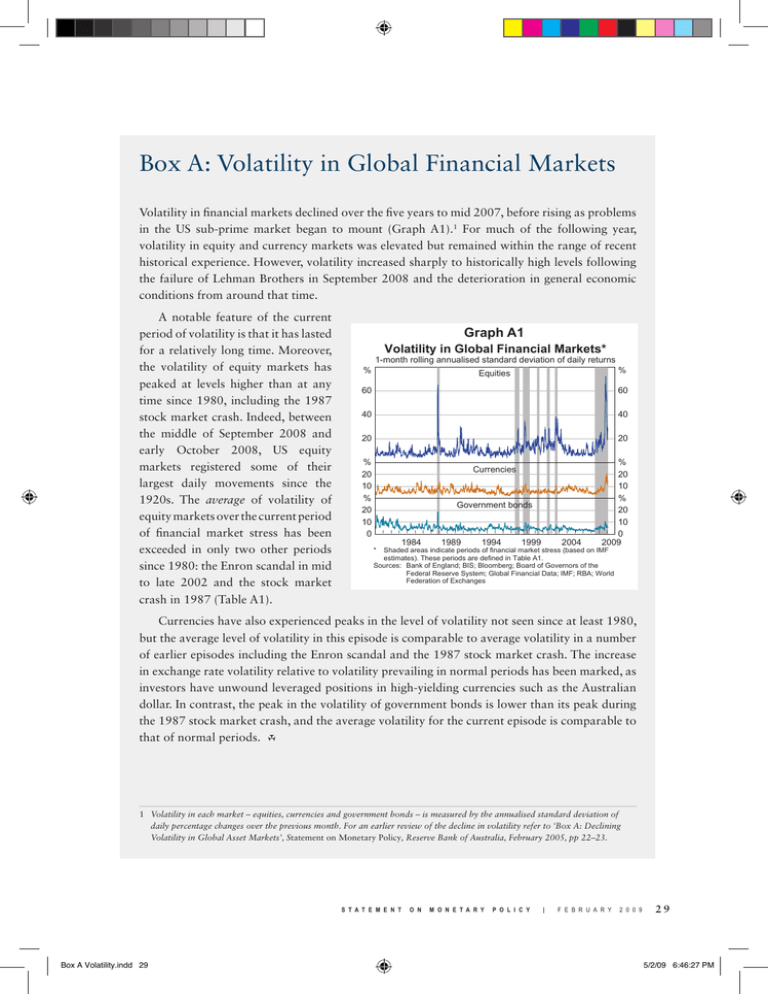
Box A: Volatility in Global Financial Markets Volatility in financial markets declined over the five years to mid 2007, before rising as problems in the US sub-prime market began to mount (Graph A1).1 For much of the following year, volatility in equity and currency markets was elevated but remained within the range of recent historical experience. However, volatility increased sharply to historically high levels following the failure of Lehman Brothers in September 2008 and the deterioration in general economic conditions from around that time. A notable feature of the current period of volatility is that it has lasted for a relatively long time. Moreover, the volatility of equity markets has peaked at levels higher than at any time since 1980, including the 1987 stock market crash. Indeed, between the middle of September 2008 and early October 2008, US equity markets registered some of their largest daily movements since the 1920s. The average of volatility of equity markets over the current period of financial market stress has been exceeded in only two other periods since 1980: the Enron scandal in mid to late 2002 and the stock market crash in 1987 (Table A1). Graph A1 Volatility in Global Financial Markets* 1-month rolling annualised standard deviation of daily returns % % Equities 60 60 40 40 20 20 % 20 10 % 20 10 0 Currencies Government bonds l l l * l l 1984 l l l l l 1989 l l l l l 1994 l l l l l l 1999 l l l l 2004 l l % 20 10 % 20 10 l l 0 2009 Shaded areas indicate periods of financial market stress (based on IMF estimates). These periods are defined in Table A1. Sources: Bank of England; BIS; Bloomberg; Board of Governors of the Federal Reserve System; Global Financial Data; IMF; RBA; World Federation of Exchanges Currencies have also experienced peaks in the level of volatility not seen since at least 1980, but the average level of volatility in this episode is comparable to average volatility in a number of earlier episodes including the Enron scandal and the 1987 stock market crash. The increase in exchange rate volatility relative to volatility prevailing in normal periods has been marked, as investors have unwound leveraged positions in high-yielding currencies such as the Australian dollar. In contrast, the peak in the volatility of government bonds is lower than its peak during the 1987 stock market crash, and the average volatility for the current episode is comparable to that of normal periods. R 1 Volatility in each market – equities, currencies and government bonds – is measured by the annualised standard deviation of daily percentage changes over the previous month. For an earlier review of the decline in volatility refer to ‘Box A: Declining Volatility in Global Asset Markets’, Statement on Monetary Policy, Reserve Bank of Australia, February 2005, pp 22–23. S t a t e m e n t Box A Volatility.indd 29 o n m o n e t a r y P o l i c y | f e b r u a r y 2 0 0 9 29 5/2/09 6:46:27 PM Table A1: Volatility in Global Financial Markets Annualised standard deviation of daily returns Episodes Non-crisis periods Sub-prime crisis – peak Sub-prime crisis – average Enron scandal September 11 Dot-com crash Russian debt default and LTCM Asian financial crisis 1987 stock market crash Period 1980:Q1 – current 2008:Q4 2007:Q3 – current 2002:Q3 2001:Q3 2000:Q2 Equities 10 72 23 28 15 19 Currencies 6 21 9 8 6 6 Government bonds 5 11 5 6 4 4 1998:Q3–1999:Q1 1997:Q3–1997:Q4 1987:Q4 18 16 32 7 5 8 6 4 10 Sources: Bank of England; BIS; Bloomberg; Board of Governors of the Federal Reserve System; Global Financial Data; IMF; RBA; World Federation of Exchanges 30 r e S e r v e Box A Volatility.indd 30 b a n k o f a u S t r a l i a 5/2/09 6:46:27 PM


![[These nine clues] are noteworthy not so much because they foretell](http://s3.studylib.net/store/data/007474937_1-e53aa8c533cc905a5dc2eeb5aef2d7bb-300x300.png)


