Glossary of Important Terms
advertisement
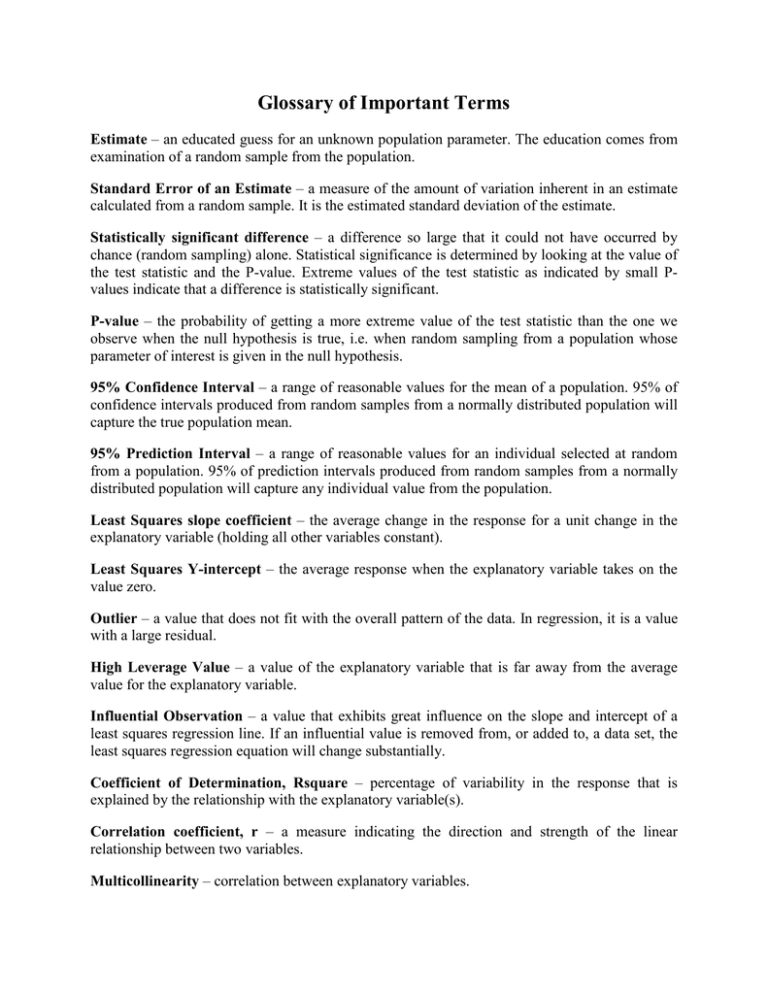
Glossary of Important Terms Estimate – an educated guess for an unknown population parameter. The education comes from examination of a random sample from the population. Standard Error of an Estimate – a measure of the amount of variation inherent in an estimate calculated from a random sample. It is the estimated standard deviation of the estimate. Statistically significant difference – a difference so large that it could not have occurred by chance (random sampling) alone. Statistical significance is determined by looking at the value of the test statistic and the P-value. Extreme values of the test statistic as indicated by small Pvalues indicate that a difference is statistically significant. P-value – the probability of getting a more extreme value of the test statistic than the one we observe when the null hypothesis is true, i.e. when random sampling from a population whose parameter of interest is given in the null hypothesis. 95% Confidence Interval – a range of reasonable values for the mean of a population. 95% of confidence intervals produced from random samples from a normally distributed population will capture the true population mean. 95% Prediction Interval – a range of reasonable values for an individual selected at random from a population. 95% of prediction intervals produced from random samples from a normally distributed population will capture any individual value from the population. Least Squares slope coefficient – the average change in the response for a unit change in the explanatory variable (holding all other variables constant). Least Squares Y-intercept – the average response when the explanatory variable takes on the value zero. Outlier – a value that does not fit with the overall pattern of the data. In regression, it is a value with a large residual. High Leverage Value – a value of the explanatory variable that is far away from the average value for the explanatory variable. Influential Observation – a value that exhibits great influence on the slope and intercept of a least squares regression line. If an influential value is removed from, or added to, a data set, the least squares regression equation will change substantially. Coefficient of Determination, Rsquare – percentage of variability in the response that is explained by the relationship with the explanatory variable(s). Correlation coefficient, r – a measure indicating the direction and strength of the linear relationship between two variables. Multicollinearity – correlation between explanatory variables.
