SVM R Example
advertisement

SVM R Example require(e1071)
set.seed(1)
x<-matrix(runif(20),ncol=1)
x<-x+c(rep(0,10),rep(.6,10))
#first 10 x's U(0,1) and last 10 x's U(.6,1.6)
x
y<-c(rep(-1,10),rep(1,10))
#first 10 y's -1 and last 10 y's 1
y
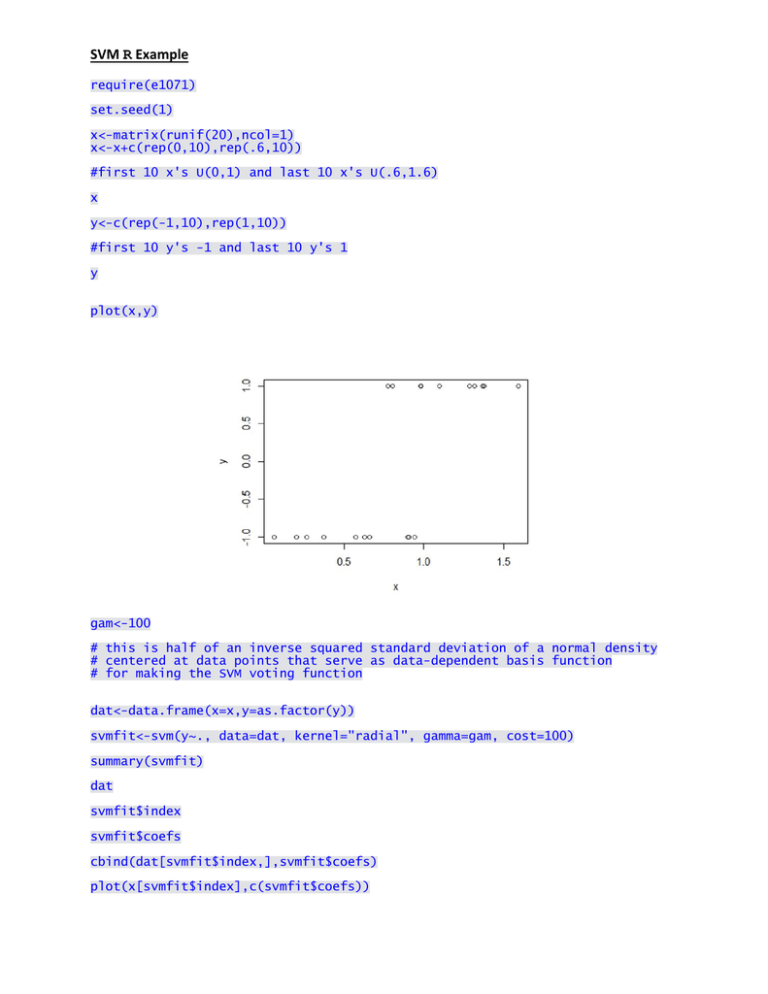
plot(x,y)
gam<-100
# this is half of an inverse squared standard deviation of a normal density
# centered at data points that serve as data-dependent basis function
# for making the SVM voting function
dat<-data.frame(x=x,y=as.factor(y))
svmfit<-svm(y~., data=dat, kernel="radial", gamma=gam, cost=100)
summary(svmfit)
dat
svmfit$index
svmfit$coefs
cbind(dat[svmfit$index,],svmfit$coefs)
plot(x[svmfit$index],c(svmfit$coefs))
#
#
#
#
define "g-beta plus beta0" function that defines the support
vector machine
I'm a bit mystified by the signs here as it seems like I have to
switch the signs on everything to get the right function
# BTW rho is -beta0
Vote<-function(z,gamma){
w<-(-svmfit$rho)
for (i in 1:length(svmfit$index)){
w<-w+svmfit$coefs[i]*exp(-gamma*(z-x[svmfit$index[i]])^2)
}
return(-w)
}
# now make the SVM predictions
# for some reason, predict(svmfit,x) doesn't seem to give the
# correct classifications
sign(Vote(x,gam))
votes<-Vote(c((1:2000)/1000),gam)
plot(c((1:2000)/1000),votes)
abline(h=0)
# here is the computation of the abstract margin, M, corresponding to the
# set of support vectors and their coefficients (alpha's)
M<-1/(sum(abs(svmfit$coefs)))^.5
M
abline(h=-1)
abline(h=1)
# these last 2 lines locate the level of margins in terms of the voting
#function (the 0 value gives the decision boundary)
rug(x[1:10],col="red",lwd=3)
rug(x[11:20],col="blue",lwd=3)


