Document 10765773
advertisement

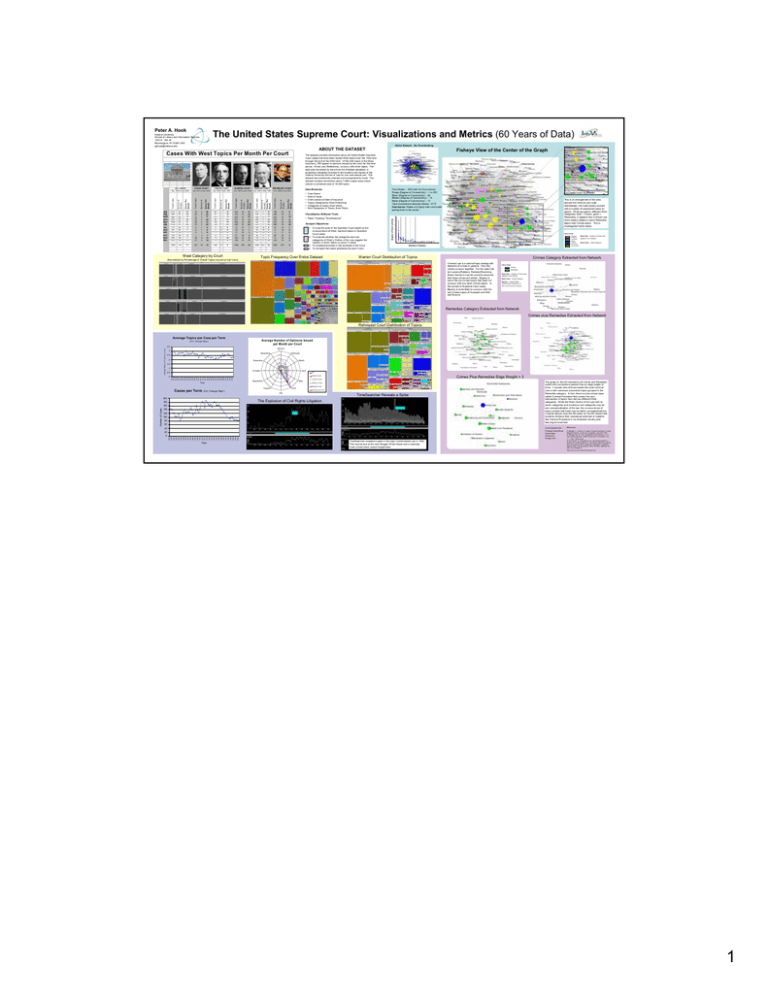
Peter A. Hook The United States Supreme Court: Visualizations and Metrics (60 Years of Data) Indiana University, School of Library and Information Science 1320 E. 10th St. Bloomington, IN 74405 USA pahook@indiana.edu Entire Dataset – No Thresholding ABOUT THE DATASET Cases With West Topics Per Month Per Court Total Cases Number of Months Cases Per Month Total Cases Total Cases Number of Months Cases Per Month 812 695 980 833 1008 2162 173 68 55 125 404 553 60 60 60 60 60 60 60 60 59 59 60 60 14 12 16 14 17 36 3 1 1 2 7 9 55 46 34 39 25 52 0 0 0 1 22 27 2 2 2 2 2 2 1 1 1 1 2 2 28 23 17 20 13 26 0 0 0 1 11 14 89 91 111 94 102 162 0 2 1 4 73 79 7 7 7 7 7 7 8 8 8 7 7 7 13 13 16 13 15 23 0 0 0 1 10 11 202 152 263 237 289 446 12 15 17 47 124 180 16 16 16 16 16 16 15 15 15 16 16 16 13 10 16 15 18 28 1 1 1 3 8 11 270 238 329 269 322 846 151 43 34 45 114 165 17 17 17 17 17 17 18 18 18 17 17 17 16 14 19 16 19 50 8 2 2 3 7 10 196 168 243 194 270 656 10 8 3 28 71 102 18 18 18 18 18 18 18 18 17 18 18 18 11 9 14 11 15 36 1 0 0 2 4 6 7868 718 11 301 20 15 808 87 9 1984 189 10 2826 207 14 1949 215 9 West Category by Court This is an enlargement of the area around the Criminal Law node. Interestingly, the node closely clusters with a number of procedural topics (in green). While grouped in different West categories (blue = Crimes, green = Remedies), it appears that Criminal Law more closely relates to some Remedies topics than Crimes topics. This is investigated further below. Visualization Software Tools: 1 2 300 3 • Pajek, Treemap, TimeSearcher Analysis Objectives: 1. To map the work of the Supreme Court based on the co-occurrence of West, top-level topics in Supreme Court cases. 2. To evaluate whether the categories and subcategories of West’s Outline of the Law suggest the manner in which topics co-occur in cases. 3. To understand trends in the workload of the Court. 4. To compare the topics addressed by each Court. Topic Frequency Over Entire Dataset (Normalized by Percentage of Overall Topics Issued by that Court) Total Nodes -- 289 (with Co-Occurrence) Range (Degree of Connectivity) – 1 to 250 Mean (Degree of Connectivity) -- 26 Median (Degree of Connectivity) -- 14 Mode (Degree of Connectivity) -- 13 Total Connections between Nodes - 3717 Conclusion: Nodes are highly inter-connected, pulling them to the center. Case Name Date of Issue Chief Justice at Date of Issuance Topics Assigned by West Publishing Categories of topics (from West) Sub-Categories of Topics (from West) Degree of Connectivity Number of Months Cases Per Month Cases Per Month Data Elements: • • • • • • Number of Oct. 1986 to Aug. 2004 Total Cases REHNQUIST COURT Cases Per Month BURGER COURT July 1969 to Sept. 1986 Number of W ARREN COURT Oct. 1953 to June 1969 Total Cases VINSON COURT July 1946 to Sept. 1953 Cases Per Month STONE COURT July 1941 to June 1946 Number of Months ALL YEARS Nov. 1944 to Aug. 2004 Total Cases JAN. FEB. MAR. APR. MAY JUN. JUL. AUG. SEP. OCT. NOV. DEC. Fisheye View of the Center of the Graph The dataset contains information about all United States Supreme Court cases that have been issued West topics from the 1944 term through the end of the 2003 term. Of the 405 topics in the West taxonomy, 290 appear in opinions issued by the court for this time period. All but one (Reference), co-occur with other topics. The data was harvested by hand from the Westlaw database--a proprietary database licensed to the students and faculty of the Indiana University School of Law for non-commercial use. The dataset was extensively cleaned and manipulated by hand. The dataset contains information about 7,868 unique cases which contain a combined total of 19,600 topics. 250 200 150 Color Code: 100 1. Persons 2. Property 3. Contracts 4. Torts 5. Crimes 6. Remedies 7. Government 50 0 0 2 4 6 8 10 12 14 16 18 Number of Nodes Warren Court Distribution of Topics Node Size ~ Number of times topic appears in the dataset Node Color ~ West Category Crimes Category Extracted from Network Criminal Law is a catchall topic dealing with elements of crimes in general. Very few crimes co-occur together. For the ones that do (Larceny/Robbery, Robbery/Receiving Stolen Goods) it may be correctly assumed that these crimes are similar. Bigamy is one of the six Crimes topics that does not co-occur with any other Crimes topics. In the context of Supreme Court cases, Bigamy is more likely to co-occur with the non-Crimes topics of Husband and Wife and Divorce. Color Code: Crimes Remedies Node Size ~ Number of times topic appears in the dataset Node Color ~ West Category Number ~ Edge Weight (reflecting the frequency of the co-occurrence of topics) Remedies Category Extracted from Network Crimes plus Remedies Extracted from Network Rehnquist Court Distribution of Topics Average Topics per Case per Term Average Number of Opinions Issued per Month per Court (Oct. through Sept.) January 50 3 December February 40 2.5 30 2 November March 20 1.5 10 1 October 0.5 April 0 All 2002 1998 2000 1996 1992 1994 1990 1986 1988 1984 1980 1982 1978 1974 1976 1972 1968 1970 1966 1962 1964 1960 1954 1956 1958 Stone Court 1948 1950 1952 0 1944 1946 Average Number of Topics per Case 3.5 September May Term Crimes Plus Remedies Edge Weight > 3 Vinson Court Warren Court Burger Court Cases per Term August June Rehnquist Court (Oct. through Sept.) July TimeSearcher Reveals a Spike 200 The Explosion of Civil Rights Litigation 180 120 100 80 60 40 Term 2002 1996 1998 2000 1994 1988 1990 1992 1986 1984 1980 1982 1978 1976 1972 1974 1970 1968 1964 1966 1962 1960 1956 1958 1954 1952 1948 1950 0 1946 20 1944 Number of Cases 160 140 The graph on the left represents all Crimes and Remedies nodes with connections greater than an edge weight of three. It reveals how interconnected the node Criminal Law is with numerous procedural topics grouped in the Remedies category. In fact, there is a law school class called Criminal Procedure that covers this very intersection of topics from the two different West categories. While the West Outline of the Law with its seven categories and numerous sub-categories may be one conceptualization of the law, the co-occurrence of topics reveals that there may be better conceptualizations. A partial domain map like the graph on the left should help students reinforce their conceptual schemas of subjects like Criminal Procedure in an otherwise visually poor learning environment. TimeSearcher revealed a spike in the topic Constitutional Law in 1982. This may be due to the new Reagan White House and a markedly more conservative Justice Department. Acknowledgements: References: Professor Katy Börner Ketan Mane Weimao Ke Rongke Gao 1. Batagelj, V., & Mrvar, A. Pajek: Program Package for Large Network Analysis, University of Ljubljana, Slovenia. 1997. 2. Shneiderman, B. Tree visualization with treemaps: a 2-d space-filling approach, ACM Transactions on Graphics, vol. 11, 1 (Jan. 1992) 92-99. 3. Hochheiser, H., Shneiderman, B. Visual Specification of Queries for Finding Patterns in Time-Series Data Proceedings Discovery Science 2001, University of Maryland, Computer Science Dept. Technical Report #CS-TR-4326. UMIACS-TR2001-25. Available at: http://www.cs.umd.edu/hcil/timesearcher/. 1


